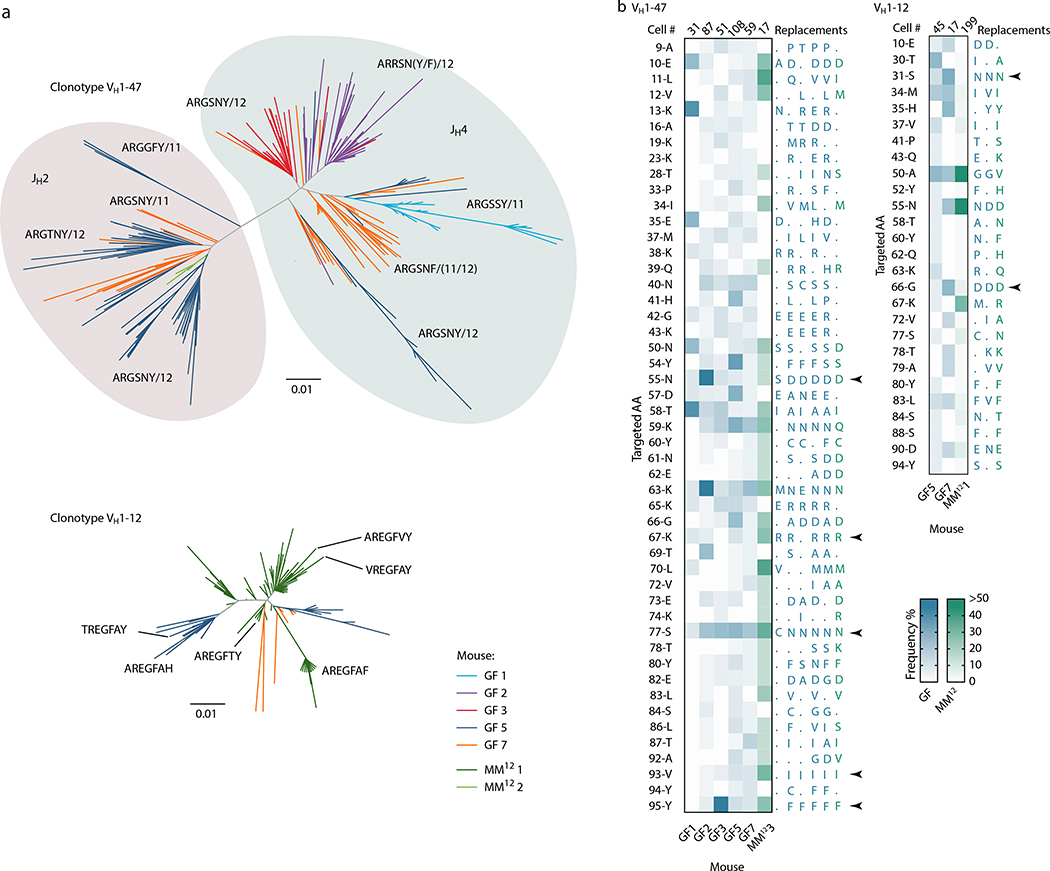
Extended Data Figure 7. Mutational patterns in GF/Oligo-MM12 public clonotypes.
(a) Dendrograms showing the sequence relationships between VH1–47 and VH1–12 clones in different mice. All clones with up to 2 aa differences from the public clonotype CDRH3 motifs are included. (b) Heatmaps depict the frequency of aa replacements along the VH1–47 and VHH1–12 families in GF (blue) and Oligo-MM12 (green) mice, using the same data as plotted in Fig. 4b. Only mice with > 2 cells within the specified clone were included in the analysis. Number of cells analyzed per mouse is indicated at the top of each column. Only aa mutated in at least 3 (VH1–47) or 2 (VH1–12) mice are listed on the left, using IMGT numbering; to the right, the most frequent aa replacement in each mouse is given. Arrows indicate recurrent aa mutations found in 5/6 mice (VH1–47) or 3/3 mice (VH1–12).

