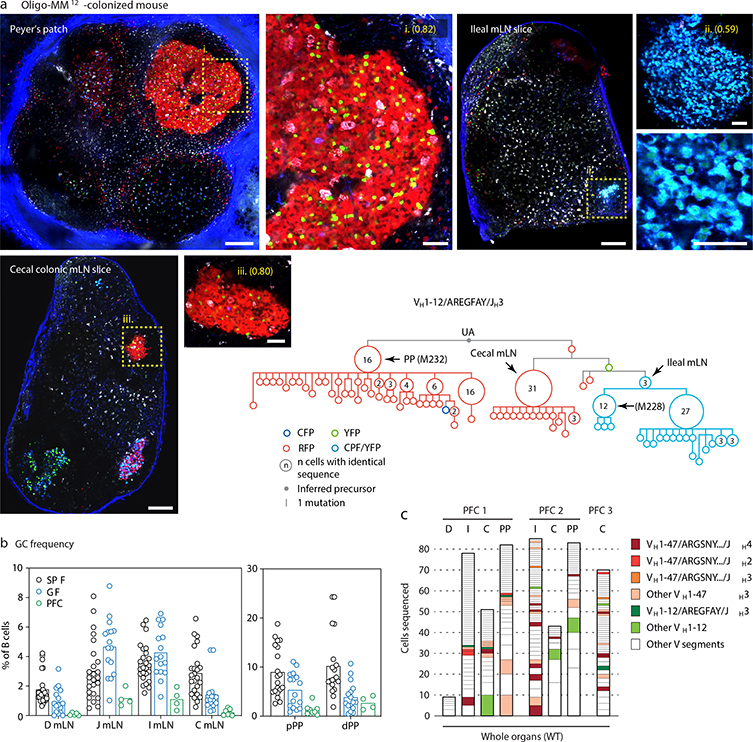
Extended Data Figure 8. Stereotypical GF IgH clonotypes are present in Oligo-MM12 and GF/dietary protein-free conditions.
(a) Massive expansion of a public VH1–12 clonotype across different secondary lymphoid organs of mouse MM12 1 (from Fig. 4b), at 21 days post-tamoxifen. Multiphoton images show all three GCs sequenced from this mouse (yellow dotted boxes), magnified in the side panels. Scalebars, 200 μm (overviews) and 50 μm (close-ups). mLN close-ups are from different image acquisitions of the same GC. A clonal tree of all cells in this clone is shown in the bottom-right. Arrowheads indicate clonal bursts and the organ of origin of cells with that particular sequence. (b) Frequency of cells with GC phenotype (CD38dimFAShi) among total B220+ B cells in the indicated organs of mice raised on protein-free chow (PFC). Data for SPF and GF mice are reproduced from Extended Data Fig. 4b. Each symbol represents one mouse. PFC n = 8 mice. (c) Clonal distribution of GC B cells sequenced from the indicated tissues of three separate mice (PFC1–3), with public clonotypes color-coded. See also Fig. 4b. D, duodenal mLN; I, ileal mLN; C, cecal colonic mLN; PP, Peyer’s patch.

