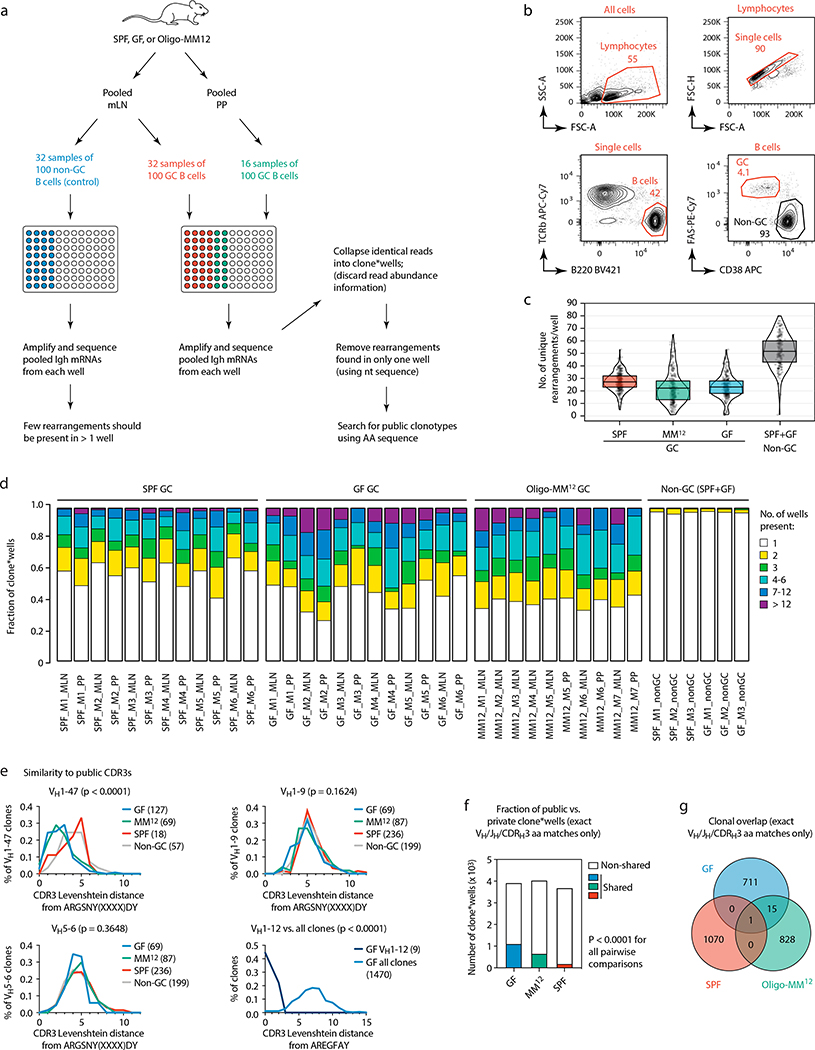
Extended Data Figure 9. Multiwell incidence-based Igh sequencing reveals clonal overlap among individual mice and between microbial colonization conditions.
(a) Schematic overview of the incidence-based Igh sequencing method used for (c-g) and Fig. 4c, d. To identify expanded public clonotypes among gaGC samples from multiple mice with high confidence, we developed an incidence-based sequencing strategy based on repeated sampling of the same GC B cell population. We sorted multiple samples of 100 GC B cells (usually 32 for mLN and 16 for PP) from 6 GF, 6 SPF, and 7 Oligo-MM12-colonized mice, and sequenced all BCRs in each sample, for a total of ~80 thousand input B cells, plus 32 wells each of non-GC B cells from the mLN of 3 GF and 3 SPF mice as controls. To avoid counting as “public” sequences that were spuriously present in different mice due to barcode misassignment or DNA contamination, we only included in our analysis clones that were represented by > 5 reads in any single well and found in at least 2 wells from the same sample. Key bioinformatics steps are described in the figure; see the Methods section for a full description of the bioinformatic pipeline. (b) Gating strategy used for data in (c-g) and Fig. 4c–d, described in (a). (c) Number of distinct clones per well, after collapsing sequences with matching VH, JH, and CDRH3 nt sequence. Each symbol represents one well. Boxes represent median and interquartile range. As expected, non-GC B cell samples had many more total clones per well than GC B cells. (d) Proportion of expanded clones (present in > 1 well per sample) in GC and non-GC samples from mLN and PP of mice held under the specified conditions. (e) Histograms of Levenshtein distance between the indicated consensus CDRH3 and the CDRH3 of all clones in the indicated category. For ARGSNYXXXXDY, distances are plotted for clones carrying the “correct” VH1–47 gene or two “control” VH regions with similar usage frequency in our sample. P-values, Kruskall-Wallis test comparing all three conditions. Due to the very low number of total VH1–12 clones outside the GF condition, distances to the AREGFAY CDRH3 are compared between VH1–12 clones and all clones. P-value, two-tailed Mann-Whitney test. (f) Fraction of clone*wells containing public clonotypes in each condition, pooled from all mice. P-values are for Fisher’s Exact test. (g) Venn diagram showing number of clones per condition (pooled from all mice) and overlap between conditions. The clone in the center of the graph (SPF/Oligo-MM12/GF overlap) corresponds to the VH1–47 public clonotype. In (f, g) data as in Fig. 4d.

