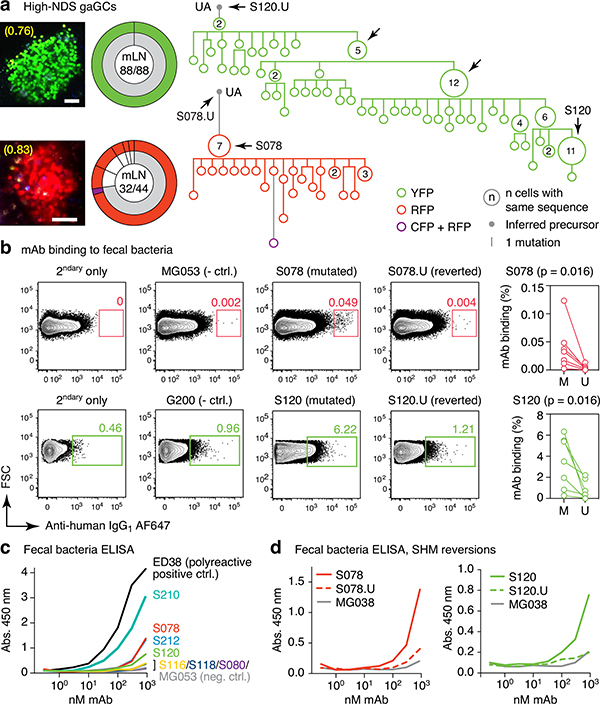
Fig. 2 |. Selection of commensal-binding clones in steady-state gaGCs.
(a) Igh sequence relationship among B cells from high-NDS GCs sorted as in Extended Data Fig. 2a. Images and pie charts show clone/color distribution for each GC. Numbers within images are NDS; numbers in pies are (cells in major clone/total cells sequenced). Phylogenies for major clones (grey in the pie charts) are shown. Arrows indicate “clonal burst” points; names are indicated whenever a recombinant mAb was generated from a sequence (see Table S1). UA, unmutated ancestor. Scalebars, 50 μm. Additional trees provided in Extended Data Fig. 2b–c. (b) Binding of mAbs to SPF fecal bacteria. Gated on SYTO BC+, DAPI– live bacteria, as in Extended Data Fig. 2d. Clone MG053 and G200 (see below) are non-bacteria-reactive negative controls. Graph summarizes 7 independent experiments (M, mutated; U, unmutated). Background (% positive in 2ndary only) is subtracted from all datapoints. P-values are for two-tailed Wilcoxon paired samples test. (c) mAb binding to fecal bacteria by ELISA. mAb dilution is indicated on the X-axis. Lines are mean of three assays. (d) As in (c) but showing mAbs S078 and S120 as well as their unmutated ancestors.

