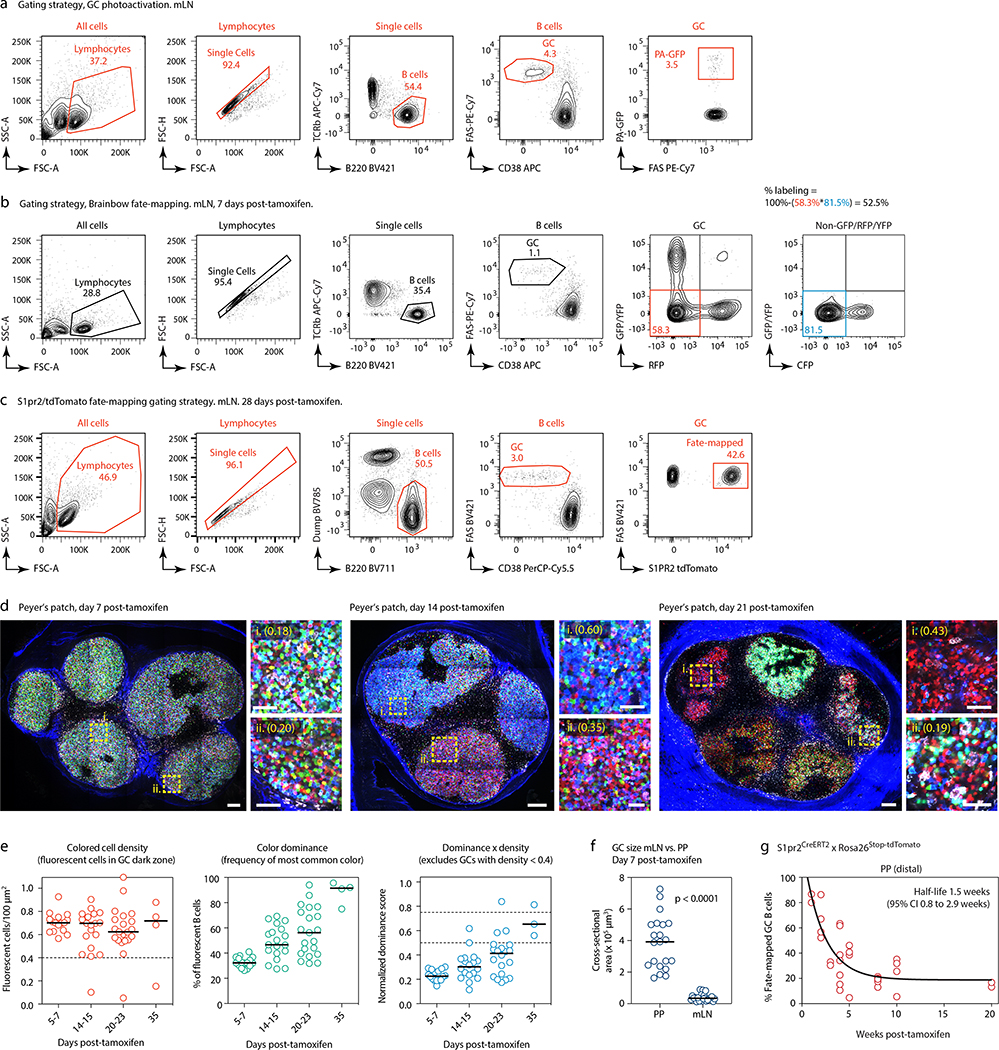
Extended Data Figure 1. Clonal replacement in steady-state gaGCs.
(a) Gating strategy for PA-GFP mice used in Fig. 1a–d. (b) Gating strategy and efficiency of labeling in GCs of AID-Confetti mice 7 days post administration of tamoxifen as in Fig. 1e. Labeling efficiency is calculated as 100% minus the product of unlabeled cells in the GFP/YFP, RFP, and CFP channels. (c) Gating strategy for S1pr2CreERT2/tdTomato fate-mapping experiments shown in (g) and Fig. 1h. All flow plots are representative of multiple experiments. (d) Multiphoton images of PP of SPF mice at different times after tamoxifen treatment, details as in Fig. 1f. (e) Quantification of multiple images as in (d), details as in Fig. 1g. Data are from 3–5 mice per timepoint at D14–35 and 1–2 mice for D7 and later timepoints. (f) GC size in PPs vs. mLNs, calculated from samples obtained 7 days after tamoxifen treatment as in (d) and Fig. 1f. Size is plotted as the cross-sectional area of the largest available Z-section. Each symbol represents one GC. Lines are median, P-values are for two-tailed Mann-Whitney U test. Data are pooled from multiple mLNs and PPs of 2 mice from 2 independent experiments. (g) Turnover of B cell clones in PP GCs from S1pr2CreERT2 x Rosa26Stop-tdTomato mice, details as in Fig. 1h.

