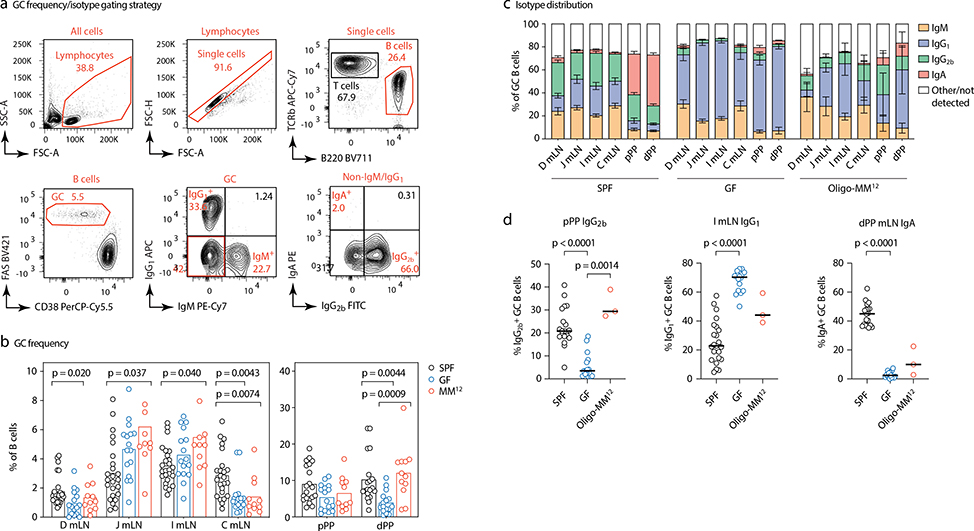
Extended Data Figure 4. Frequency and isotype distribution of gaGCs in GF and Oligo-MM12-colonized mice.
(a) Gating strategy for GC frequency and isotype distribution shown in b-d. (b) Frequency of cells with GC phenotype (CD38–FAShi) among total B220+ B cells in the indicated organs of mice raised under the indicated conditions. Each symbol represents one mouse. SPF, n = 25; GF, n = 16; Oligo-MM12, n=11. (c) Frequency GC B cells positive for the indicated surface BCR isotype in different organs of mice raised under the indicated conditions. Data are from at least 3 mice per group, as in (d). Data are presented as mean +/− SEM. (d) Statistical analysis of selected isotypes and anatomical locations, using data from (c). Each symbol represents one mouse. Lines indicate median; P-values are for two-tailed Kruskall-Wallis test done on each trio, with Dunn’s multiple comparisons post-test. All P-values below 0.05 are reported.

