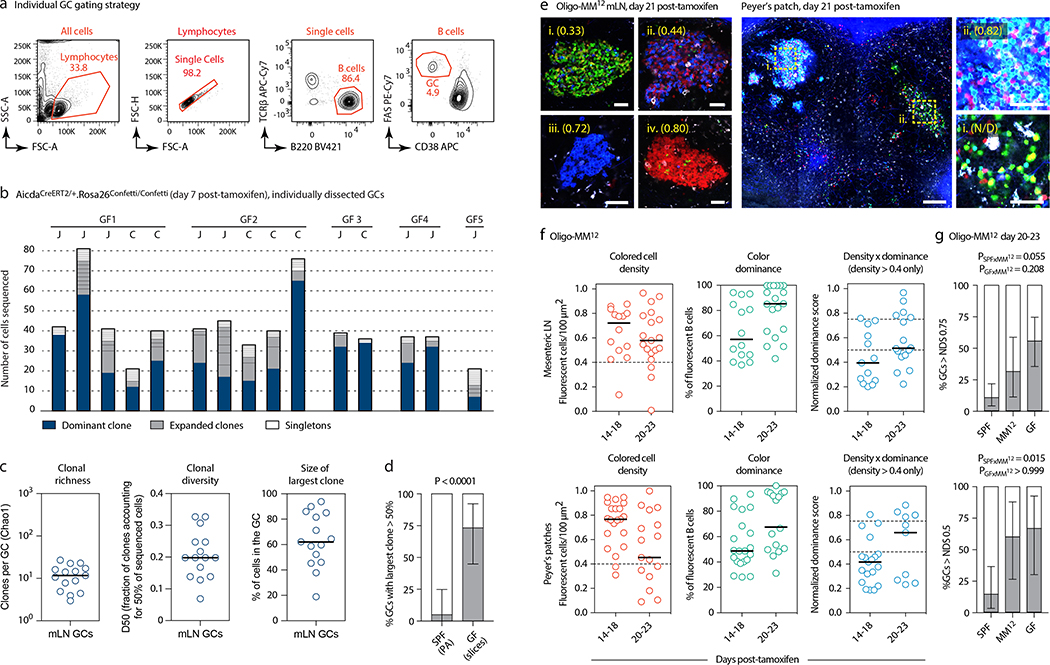
Extended Data Figure 5. Clonal selection in GF and Oligo-MM12-colonized mice.
(a) Gating strategy for GF AID-Confetti single GCs used in (b-d). (b-d) Sequencing of Igh genes of B cells obtained from individual mLN GCs. GC B cells were single-sorted from fragments of vibratome slices containing a single GC. To avoid biased selection of GCs based on NDS or loss of GCs with low colored cell density, mLN were harvested at 5–7 days post-tamoxifen, prior to extensive selection or clonal turnover, and both fluorescent and non-fluorescent cells were included in the sample. This unbiased selection ensures that data are comparable to those obtained using in situ photoactivation (Fig. 1a–d), which we could not perform because the photoactivatable GFP-transgenic strain is not available under GF status. (b) Clonal composition of individual GCs from five mice (GF1–5). J, jejunal; C, cecal-colonic mLN. (c) Quantification of data in (b). Each symbol represents one GC. (d) Proportion of GCs in which the largest clone accounts for > 50% of all B cells in mLN of SPF (data from Fig. 1b) and GF mice (b). P-value is for two-tailed Fisher’s exact test. Center bars represent the proportion in the sample, error bars are the exact binomial 95% confidence interval. (e) Multiphoton images of Oligo-MM12 mLN and PP at different times after tamoxifen. Blue is collagen (2nd harmonics), white is autofluorescence, other colors are from the Confetti allele. Scalebars, 200 μm (overviews), 50 μm (close-ups). N/D, NDS not determined due to low colored cell density. (f) Quantification of images as in (e) for mLN (top) and PP (bottom). Each symbol represents one GC. Median indicated. Only GCs with density > 0.4 fluorescent cells/100 μm2 are included in NDS calculation. (g) Proportion of GCs with NDS > 0.75 in mLNs (top) and > 0.5 in PPs (bottom) under SPF, GF, and Oligo-MM12 conditions at 20–23 days post-tamoxifen, SPF and GF data as in Fig. 3c. For SPF, Oligo-MM12 and GF mLN gaGCs, n = 57, 16, and 27, respectively. For PP gaGCs n=21, 10, and 9, respectively. P-value is for two-tailed Fisher’s exact test. Error bars represent the exact binomial 95% confidence interval. All data are from 3–5 mice per timepoint.

