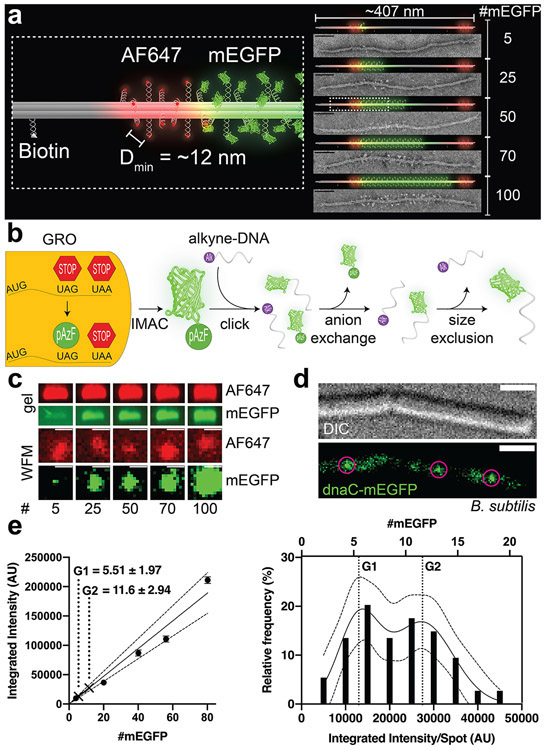
Figure 1.
A DNA-origami-based mEGFP brightness standard. (a) 3D models and TEM micrographs of monomeric DNA 6hb structures labeled with 5–100 copies of mEGFP (green) in the main body, 12 copies of Alexa Fluor 647 (red) at each end, and 4 biotin molecules along one side. The minimum spacing of the fluorophores is ~12 nm. Scale bars: 50 nm. (b) Generation of mEGFP-DNA conjugate. mEGFP-pAzF is expressed and purified from a GRO, in which the antisense TAG codon has been reassigned to encode pAzF, an azide-modified Phe. mEGFP(pAzF) was purified via immobilized metal affinity chromatography (IMAC), then reacted with alkyne-labeled DNA. Two subsequent purification steps removed unreacted proteins and DNA. (c) Gel electrophoresis (top) and widefield microscopy images (WFM, bottom) of mEGFP standards. Images are set to the same brightness scale (no saturated pixels in the original images). Scale bars: 2 μm. (d) Differential interference contrast (DIC, top) and WFM (bottom) images of B. subtilis (strain NW001) expressing dnaC-mEGFP. Circles indicate puncta picked for quantification. Scale bars: 2 μm. (e) Quantifying dnaC-mEGFP. Left: a calibration curve with intensities of DNA-origami standards and interpolated protein counts (mean±SEM) from dnaC-mEGFP puncta. Dotted lines denote 95% confidence interval. Right: frequency distribution and sum-of-two-Gaussians fit of dnaC-mEGFP puncta.

