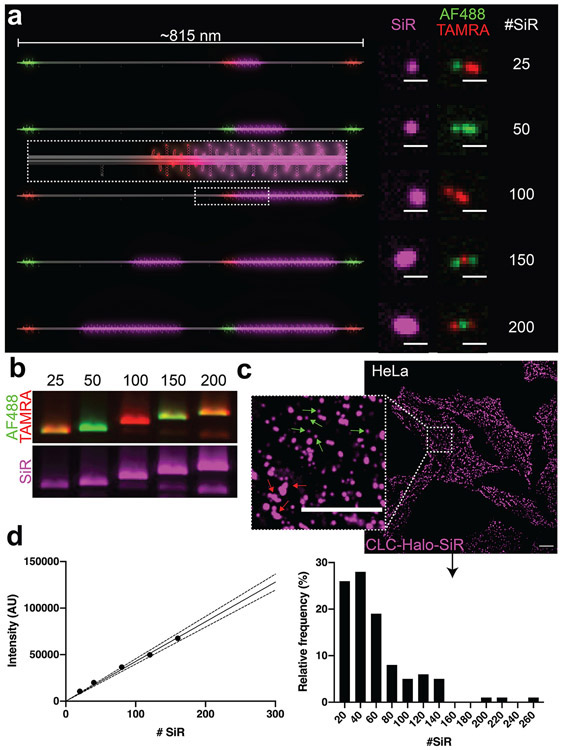
Figure 2.
A DNA-origami-based SiR brightness standard. (a) 3D models of dimeric DNA-origami nanotubes hosting 25–200 SiR molecules (magenta) in the main body, as well as Alexa Fluor 488 (Green) and TAMRA (red) at three distinct locations (12 fluorophores at each location) for barcoding. Confocal microscopy images revealed the expected barcoding patterns and corresponding increase in SiR intensity. Scale bars: 1 μm. (b) Agarose gel images of SiR standards show the expected combinations of barcoding dyes Alexa Fluor 488 and TAMRA, as well as increasing SiR intensity. (c) Confocal images of HeLa cells expressing Halo-fused clathrin light chain (CLC) after labeling with SiR-chloroalkane. Inset shows details of coated pits (small and round, green arrows) and plaques (larger and irregularly shaped, red arrows). Scale bars: 10 μm. (d) Quantifying SiR-labeled CLCs. Left: Calibration curve generated from DNA-origami-based SiR standards (SEM too small to see). Dotted lines denote 95% confidence interval. Right: Spots containing SiR-labeled CLCs binned by molecule number.

