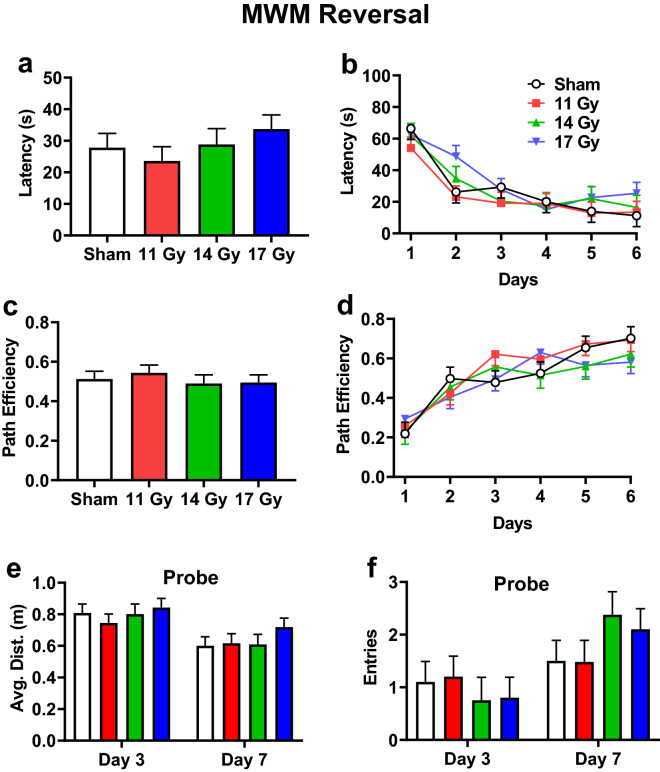
Figure 8.
Reversal phase Morris water maze performance in proton irradiated and control rats. (a) Overall effect on latency to the platform. (b) Learning curve for latency with all groups. (c) Overall effect on path efficiency. (d) Learning curve for path efficiency. e. Average distance from the former platform site on day-3 and -7 probe trials. (f) Number of entries into the former platform site on day-3 and day-7 probe trials. No group differences were found. N = 10/control, 11 Gy, and 17 Gy and n = 8 for the 14 Gy.

