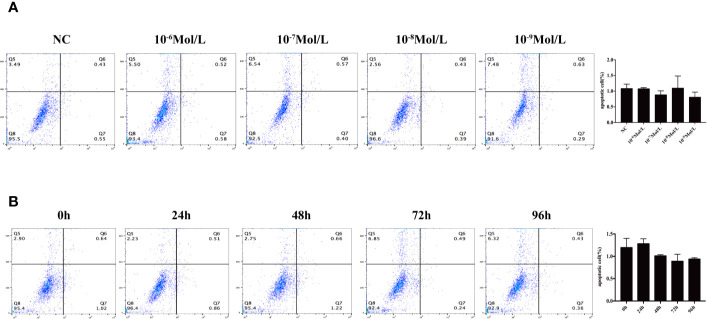
Figure 4.
Flow cytometry to detect apoptosis. (A) Concentration gradient experiment after the stimulation for 72 h. (B) Time gradient experiment with 10-8 mol/L E2 Q5: percentage of dead cells, Q6: early apoptotic cells, Q7: late apoptotic cells, and Q8: normal living cells. There was no statistical difference between different groups.

