Figure 1.
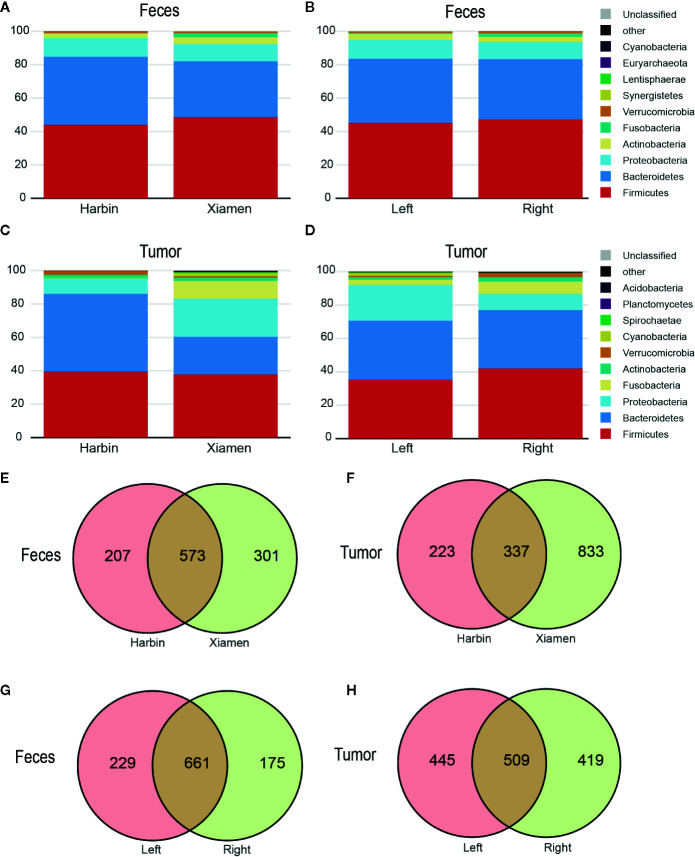
The microbial profile shows differences among the different groups. OTUs with at least 97% similarity within either patient group were classified at the phylum taxonomic level. Each bar represents the fecal or tumor microbial composition between the different groups. (A) Fecal and (C) tumor microbe composition in Harbin and Xiamen. (B) Fecal and (D) tumor microbe composition in the left- and right-sided colon samples. The scaled Venn diagrams prepared based on the fecal (E) and tumor samples (F) show the number of OTUs shared among the Harbin patients (pink), the Xiamen patients (yellow), and both groups (brown). The Venn diagrams prepared based on the fecal (G) and tumor samples (H) show the number of OTUs in LCC (pink), RCC (yellow), or both (brown).

