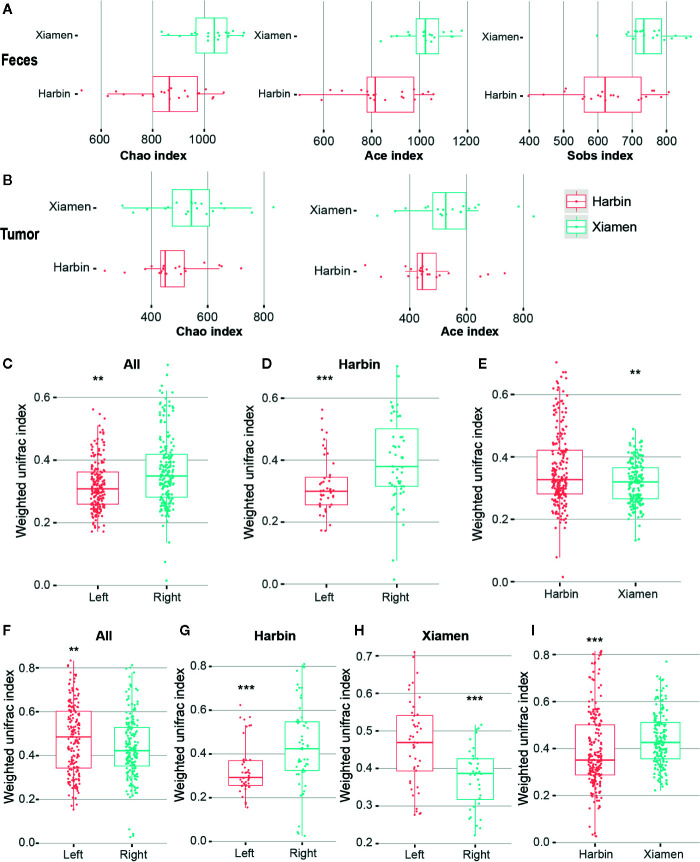
Figure 3.
Diversity analysis of LCC and RCC. Qiime software was used to calculate the alpha diversity based on OTUs. (A) Alpha diversity indexes (Chao1, ACE and Sobs) obtained for the stool samples from Xiamen and Harbin with p-values less than 0.001. (B) Differences in the Chao1 and ACE indexes obtained for the tumor samples from Xiamen and Harbin exhibited p-values less than 0.05. A UPGMA cluster analysis was performed using the weighted UniFrac distance matrix. The average weighted UniFrac distance values (beta diversities) based on the fecal samples between the total left and right samples (C), between the left and right samples from Harbin (D) and between Xiamen and Harbin (E) are shown. Statistically different differences were found between the total left and right samples (F), between the left and right samples from Harbin (G), between the left and right samples from Xiamen (H) and between Xiamen and Harbin (I); the average weighted UniFrac distance values are shown. **P < 0.01, ***P < 0.001.

