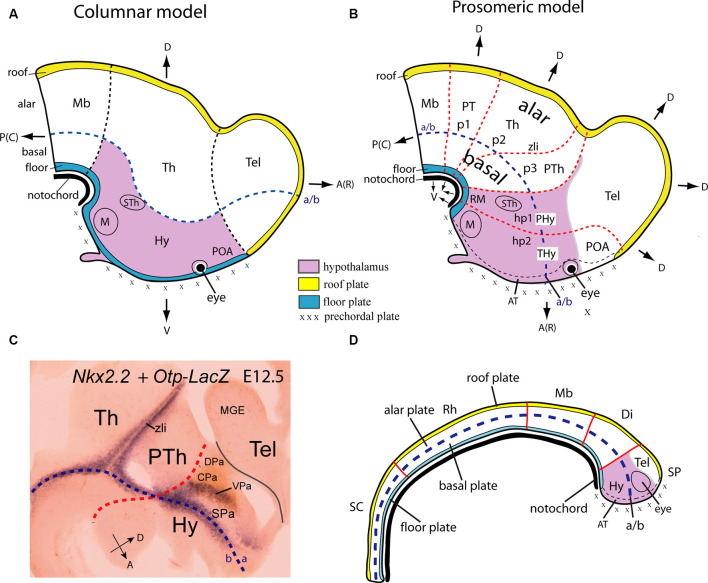
Figure 1.
Location of the hypothalamus, and its boundaries with neighboring structures, according to Swanson’s columnar (A) and Puelles and Rubenstein’s updated prosomeric (B) models. Schemata represent the forebrain at approximately embryonic E16 (human; O’Rahilly and Müller, 1999) and E12.5 (mouse) stages. A Color-code map is indicated. The hypothalamic area is marked in lavender color. In the modified columnar model of Swanson (A; 1992, 2003), the hypothalamus, located caudal to the telencephalon (Tel) and including the preoptic area (POA) is conceived explicitly as the diencephalic basal plate. By contrast, in the prosomeric model (B) the hypothalamus excludes the POA, lies ventral to the telencephalon, and rostral to the prethalamus (PTh), the rostralmost diencephalic prosomere. The postulated alar-basal boundary (a/b), a typical axial reference, is interpreted differently in these models; it is marked in both (A,B) as a blue dash line. Differences between the notions of dorsoventral (D, V) and anteroposterior [or rostrocaudal; A(R), P(C)] spatial dimension are illustrated in both models as well as the color code applied to the extreme longitudinal zones or plates: roof (yellow), alar, basal (both uncolored) and floor (blue). Black dash lines in the columnar model (A) indicate the postulated limits of the diencephalon (including the hypothalamus) with the midbrain and telencephalon; note the posterior hypothalamus plus other thalamic regions contact the rostrally expanded midbrain (Mb). Red dash lines in (B) illustrate transverse interneuromeric boundaries between the transverse prosomeric units (midbrain, Mb; diencephalon with pretectal, thalamic, and prethalamic prosomeres, p1-p3, and alar PT, Th, PTh domains; hypothalamo-telencephalic prosomeres, hp1, hp2). The intrahypothalamic hp1/hp2 border subdivides the hypothalamus into two rostrocaudal halves, the terminal and peduncular domains (THy, PHy), and the a/b limit subdivides it in alar and basal hypothalamic regions. (C) Nkx2.2 expression in a sagittal section of a mouse embryo at E12.5 (blue signal) carrying an immunoreacted Otp-LacZ construct (brown reaction). The longitudinal Nkx2.2 positive band overlaps with the alar-basal boundary (blue dash line) except at the orthogonally labeled zona limitans intrathalamica spike (zli), which identifies the transverse thalamo-prethalamic border. The red dash line indicates the transverse prethalamo- (or diencephalo)-hypothalamic boundary, caudal to the Otp-positive paraventricular complex (Pa); the thin black line defines the longitudinal telencephalo-hypothalamic boundary. (D) Scheme illustrating the early major dorsoventral and anteroposterior subdivisions in the closed neural tube (red lines) and their relationship with the notochord (in black) at approximately embryonic E12 (human) and E9.5 (mouse) stages. Note the epichordal location of the secondary prosencephalon (SP), including the prospective hypothalamus (in lavender), under the prospective, not yet evaginated telencephalon field (Tel). The forebrain tagma comprises midbrain (Mb), diencephalon (Di), and SP in the updated prosomeric model, rostrally to the rhombencephalon (Rh) and spinal cord (SC) tagmata. Other abbreviations: AT, acroterminal area; CPa, central paraventricular subarea; DPa, dorsal paraventricular subarea; Hy, hypothalamus; M, mamillary region; MGE, medial ganglionic eminence; RM, retromamillary region; SPa, subparaventricular domain; STh, subthalamic nucleus; VPa, ventral paraventricular subarea. (A,B) Modified from Puelles and Rubenstein (2015), (C) modified from Puelles et al. (2012), and (D) modified from Puelles and Martinez (2013).

