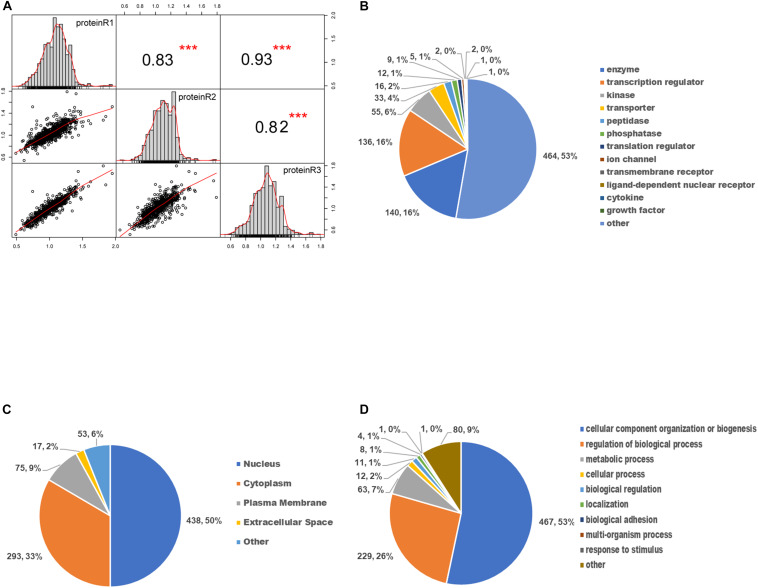
FIGURE 4.
Gene ontology enrichment analysis of differentially expressed phosphoproteins. (A) The scatter plot matrix of Pearson correlation between replicate experiments (proteinR1-R3) shows that the reproducibility is high (***p < 0.001). (B) Molecular function analysis of differentially expressed phosphoproteins. (C) Cellular component analysis of differentially expressed phosphoproteins. (D) Biological process analysis of differentially expressed phosphoproteins.

