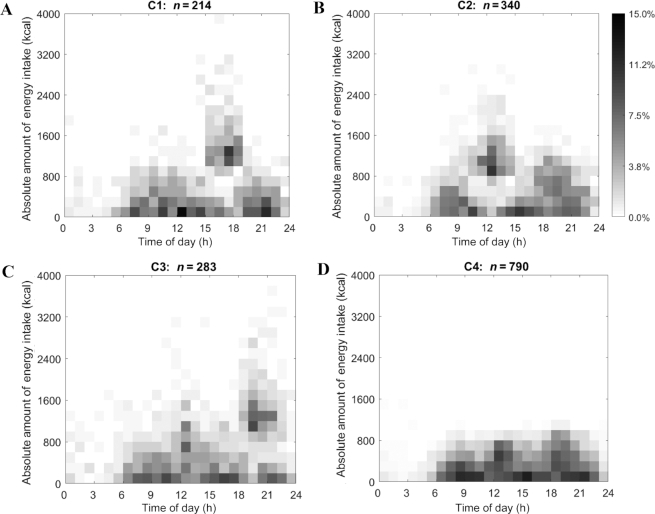
FIGURE 1.
Heat maps for MDTW clusters (A–D) which depict the absolute amount of energy intake ranging from 0 kcal to 4000 kcal (y-axis) for US adults aged 20–65 y as drawn from NHANES 2003–2006 over a 24-h day from time 00:00 to time 24:00 the next day (x-axis). The proportion of the sample is indicated by the inverse gray-scale legend with 0.0% of the cluster participants to 15.0% of the cluster participants. MDTW, modified dynamic time warping.

