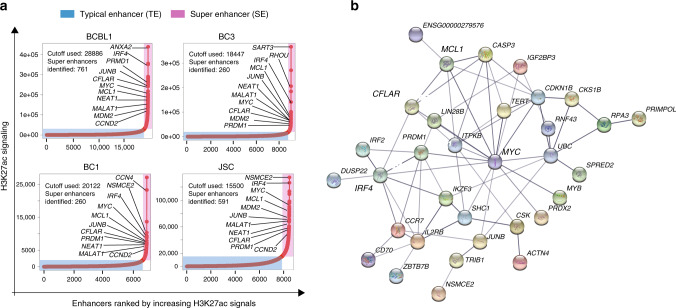
Fig. 1. PEL SEs and their linked genes.
a Enhancers were ranked by their H3K27ac CHIP-seq signals. The inflection point on the plotted curve was then selected as the cutoff to separate SEs from typical enhancers. SEs are indicated in red box. Typical enhancers are indicated in blue box. SEs were linked to their direct target genes by H3K27ac HiChIP. Genes important in B cell biology and oncogenesis are indicated by arrows. b SE-linked genes common in four PEL cell lines were analyzed using STRING (https://string-db.org/) with default settings. Gene interaction network formed around MYC is shown.

