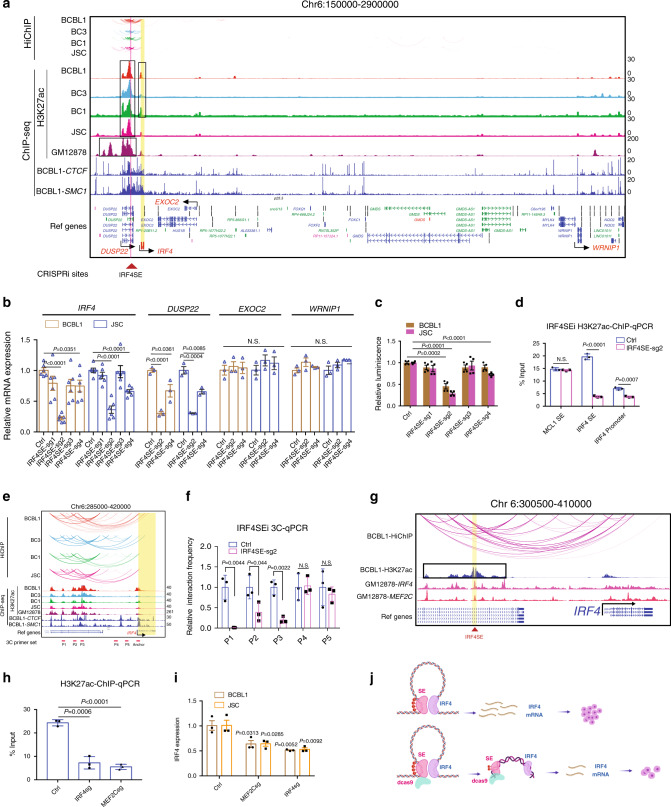
Fig. 3. SE control IRF4 expression and PEL cell growth.
a PEL H3K27ac HiChIP and ChIP-seq tracks, and GM12878 H3K27ac, BCBL1 CTCF, and SMC1 ChIP-seq tracks are shown. Vertical yellow line indicates IRF4. Vertical blue line indicates GM12878 IRF4 and MEF2C binding site. Black boxes indicate SEs. Curved line indicates significant HiChIP link. Black arrows indicate neighboring genes with significant H3K27ac ChIP-seq signals. The positions of CRISPRi sgRNAs are indicated at the bottom. b RNA expression following CRISPRi inhibition of IRF4 SE in BCBL1 and JSC cells by qRT-PCR. EXOC2 and WRNIP1 not linked by IRF4 SE were used as negative control (n = 6, independent experiments for IRF4 mRNA detection, n = 3, independent experiments for other genes detection). c BCBL1 and JSC cell growth following CRISPRi inhibition of IRF4 SE (n = 4, independent experiments. The error bars indicate SEM for the averages across the multiple experiments). d H3K27ac ChIP-qPCR at IRF4 SE and promoter following CRISPRi inhibition of IRF4 SE. MCL1 SE was used as a negative control (n = 3, independent experiments). e Positions of anchor primer and other primers used in 3C assay are indicated. f CRISPRi or non-targeting control treated cells were fixed and DNAs were cut with Hind III. Diluted DNA ends were ligated. After reverse cross-linking, the DNA was purified and quantitated by qPCR with one primer anchored at IRF4 promoter and the other one in SE or between SE and promoter. The control treated cells were set to 1 (n = 3, independent experiments). g BCBL1 H3K27ac, GM12878 IRF4, MEF2C ChIP-seq, and BCBL1 HiChIP (red curved lines) tracks at the IRF4 locus. IRF4 is indicated by black arrow. IRF4 SE was boxed in black. Yellow line indicates GM12878 IRF4, MEF2C ChIP-seq peaks overlapped with IRF4 SE and positions for qPCR primers for the following CRISPR knock out and ChIP-qPCR. h MEF2C and IRF4 were knocked down in BCBL1 cells by CRISPR. H3K27ac ChIP-qPCR was done following gene knock out. Control knock out was set to 1 (n = 3, independent experiments). i IRF4 expression following MEF2C and IRF4 knock out in BCBL1 and JSC cells by qRT-PCR (n = 3, independent experiments). j Graphic model of IRF4 SE silencing by CRISPRi decreased IRF4 SE H3K27ac signals and IRF4 SE–promoter interactions, leading to suppressed IRF4 expression and reduced cell growth. A two-tailed unpaired t-test was used for statistical analysis. The error bars indicate the SEM for the averages across the multiple experiments. Source data are provided as a Source Data file.

