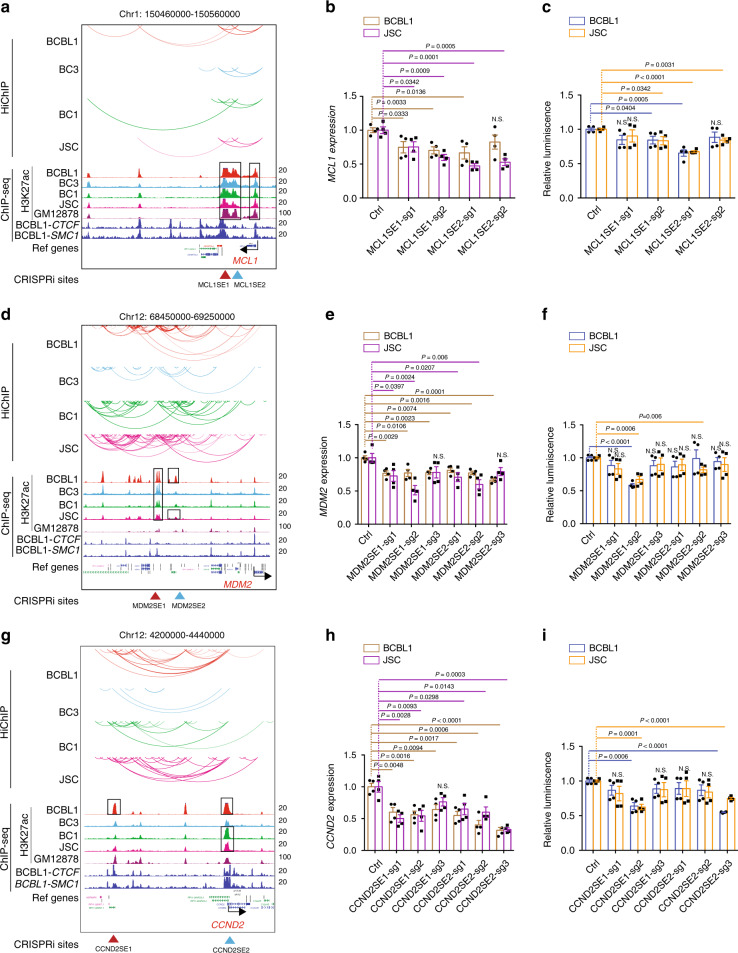
Fig. 4. SEs control MCL1, MDM2, and CCND2 expression and PEL cell growth.
a H3K27ac HiChIP linked SEs to MCL1. H3K27ac HiChIP links between SEs and target genes are shown by curved lines on the top. H3K27ac ChIP-seq tracks are shown under the links. BCBL1 CTCF and SMC1 tracks are also shown. SEs are marked by black boxes. b CRISPRi targeting SE significantly reduced MCL1 gene expression, by qRT-PCR. The levels of control sgRNA-treated cells were set to 1 (n = 4, independent experiments). c CRISPRi targeting MCL1 SE inhibits cell growth. PEL cell growth following CRISPRi treatment was measured by CellTiter Glo luminescent assay that measures live cell number (n = 4, independent experiments). d H3K27ac HiChIP linked SEs to MDM2. e CRISPRi targeting SEs significantly reduced MDM2 gene expression (n = 4, independent experiments). f CRISPRi targeting MDM2 SE inhibits cell growth (n = 4, independent experiments). g H3K27ac HiChIP linked SEs to CCND2. h CRISPRi targeting CCND2 SE significantly reduced CCND2 expression (n = 4, independent experiments). i CRISPRi targeting CCND2 SE inhibits cell growth (n = 4, independent experiments). A two-tailed unpaired t-test was used for statistical analysis. The error bars indicate the SEM for the averages across the multiple experiments. Source data are provided as a Source Data file.

