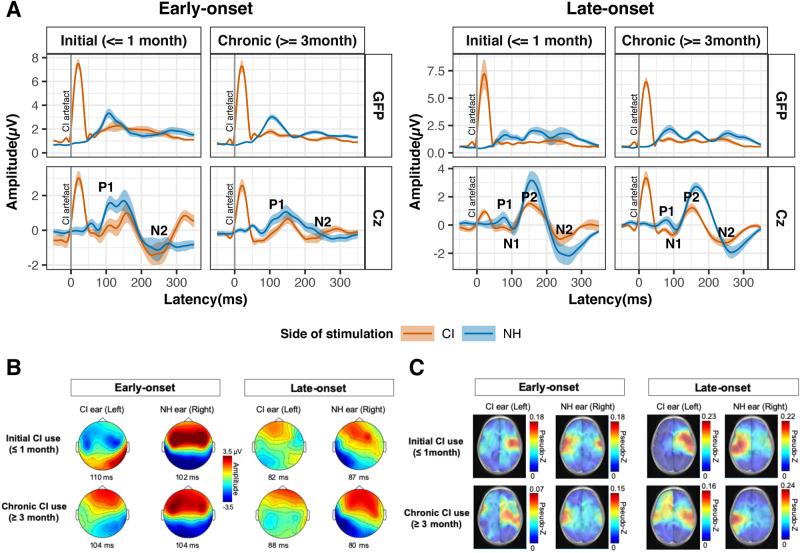
Figure 1.
Auditory-evoked surface and source cortical activity. (A) The global field power (GFP; spatial standard deviation of surface potentials across electrodes) and cortical response at Cz electrode were averaged per group at two stages of initial cochlear implant (CI) use (0–1 month, early-onset: 15 responses in 11 children; late-onset: 6 responses in 6 children) and chronic CI use (≥ 3 month, early-onset: 27 responses in 15 children; late-onset: 14 responses in 6 children). Mean (solid line) ± standard error (shaded region) amplitude was plotted as a function of post-stimulus time for each stimulation mode. (B) Topographic distribution of mean average-referenced EEG activity across the surface of the head at the peak latency. (C) Axial view of mean evoked source activity (post-omnibus pseudo-Z) in ~ 64 k voxels that were evaluated using the TRACS beamformer shows the highest activation in the auditory cortex contralateral to the stimulated ear (normal hearing (NH) or cochlear implant (CI)). Note: The images in (B) and (C) were generated by flipping the x-axis in right CI users before averaging for display.

