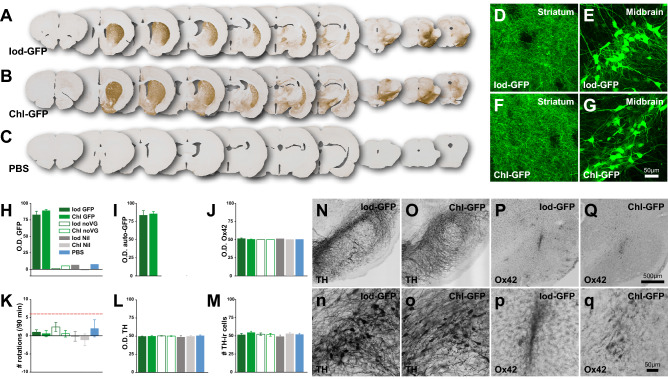
Figure 4.
In vivo comparison of production methods on transgene expression and inflammation. Overview of a coronal 1:12 series of the brains labelled for GFP for the two main experimental groups (A-Iod-GFP; B-Chl-GFP) as well for the PBS-injected control group (C). Note that overviews for the four remaining control groups are supplied in the Supplementary Fig. S2). (D–G) High power confocal microscopy images displaying the strong expression of GFP in the terminal fibres in the striatum (D,F) and the cell bodies in the substantia nigra (E,G). Optical density analysis using ImageJ for the three proteins GFP, Ox42 and TH are presented in (H–J,L), respectively. (K) The response to 2.5 mg/kg d-amphetamine was averaged over 90 min. The dotted red line indicates the threshold of well lesioned animals. (M) Quantifications of TH-ir cells in the substantia nigra, expressed as percentage of the injected side compared to the uninjected side. Midbrain dopamine cells do not show obvious signs of degeneration (N,o) and there is only a mild inflammation response at the site of the injection as indicated by the microglial marker Ox42/cd11b (P,q).

