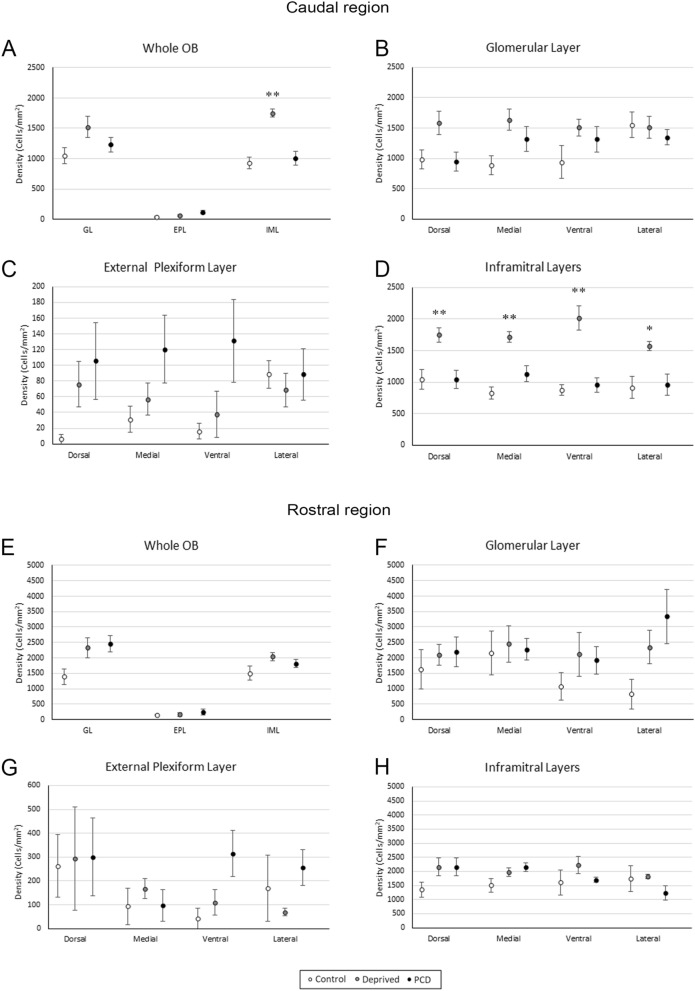
Figure 3.
Quantification of SCGN expression in the caudal (A–D) and rostral levels (E–H) of the OB. The graphs show the variation in cell density within the glomerular layer (GL), the external plexiform layer (EPL) and inframitral layers (IML) in control (white), deprived (gray) and PCD (black) mice. As can be observed, there are significant variations in the inframitral layers of deprived animals compared to the control mice in the caudal, whereas in the rostral level there are no significant differences. *p < 0.05, **p < 0.01.

