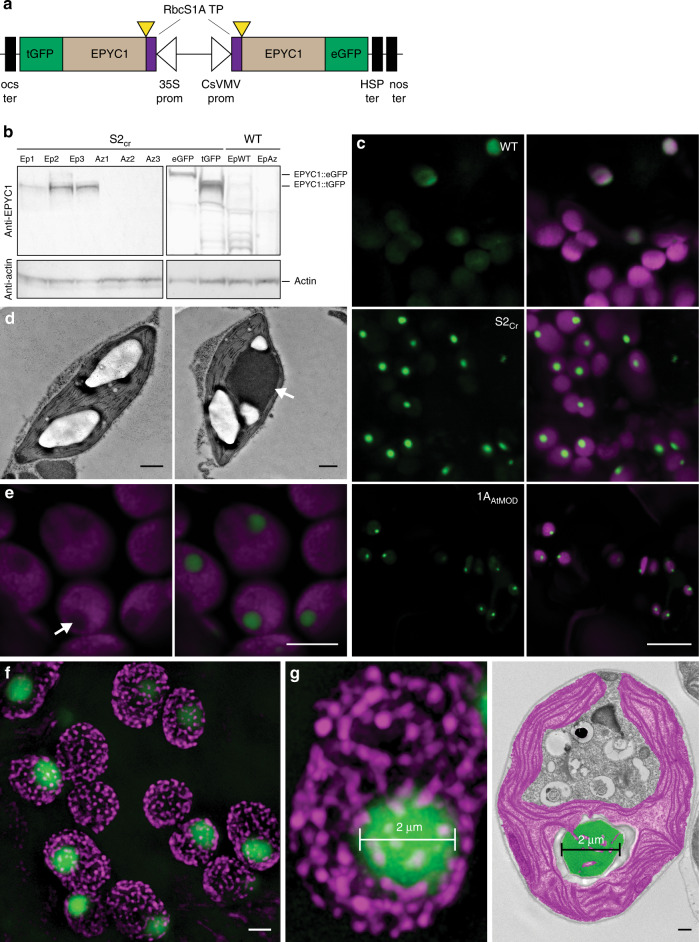
Fig. 1. Expression of EPYC1 in the Arabidopsis line S2Cr results in condensate formation.
a Schematic representation of the dual GFP expression system (EPYC1-dGFP) for EPYC1 truncated at amino acid residue 27 (as indicated by yellow triangles) and fused at the N-terminus to the chloroplastic transit peptide (TP) sequence of the Arabidopsis Rubisco small subunit RbcS1A. EPYC1 was further fused at the C-terminus to either enhanced GFP (eGFP) or turboGFP (tGFP), and driven by the 35S CaMV promoter (35S prom) or CsVMV promoter (CsVMV prom), respectively. For the latter expression cassette, a dual terminator system was used to increase expression53 (Supplementary Fig. 1). b EPYC1 protein levels in Arabidopsis plants as assessed by immunoblot analysis with anti-EPYC1 antibodies. Shown are three T2 S2Cr transgenic plants expressing EPYC1-dGFP (Ep1−3) and azygous segregants (Az1−3), and S2Cr plants transformed with only EPYC1::tGFP (55.4 kDa) or EPYC1::eGFP (63.9 kDa). Also displayed are a T2 EPYC1-dGFP WT transformant (EpWT) and azygous segregant (AzWT). Anti-actin is shown as a loading control underneath. c Expression of EPYC1-dGFP in WT, S2Cr and 1AAtMOD backgrounds. Green and purple signals are GFP and chlorophyll autofluorescence, respectively. Overlapping signals are white. Scale bar = 10 µm for all images. d TEM images of chloroplasts from S2Cr plants with (right) and without (left) expression of EPYC1. A white arrowhead indicates the dense dark grey area of the EPYC1 condensate. The large white structures are starch granules. Scale bars = 0.5 µm. A representative chloroplast from a wild-type plant expressing EPYC1-dGFP is shown for comparison in Extended Data Fig. 3. e Chlorophyll autofluorescence is reduced at the site of EPYC1-dGFP accumulation (white arrow). Scale bar = 5 µm. f SIM microscopy showing EPYC1-dGFP condensates inside the chloroplast (see also Supplementary Movie 1). The magenta puncta show the position of grana stacks. Light magenta puncta indicate grana stacks behind the condensate. Scale bar = 2 µm. g Example comparison of condensate size (left, 2 µm) with that of a pyrenoid in Chlamydomonas (right, representative TEM image highlighting the pyrenoid in green and chloroplast in purple). Scale bar for TEM image = 0.5 µm. Images of EPYC1-dGFP condensates in the S2Cr background are from line Ep3 (c, e, f, g). Confocal images are representative of multiple imaging sessions (c, e). SIM microscopy (f, g) imaging was performed once. The immunoblots shown were derived from the same experiment and gels/blots were processed in parallel. Immunoblots results were representative of six gels/blots (a), TEM images are representative of 26 and 12 images from S2Cr plants with and without EPYC1, respectively (d) and 55 images from Chlamydomonas (g). Source data are provided as a Source Data file.

