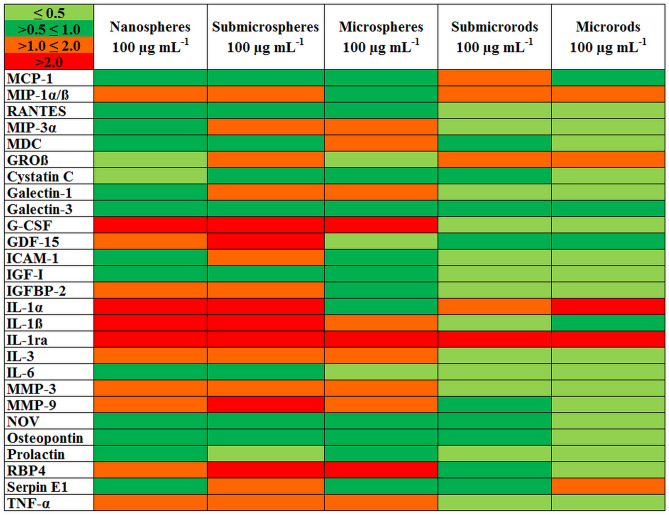
Figure 10.
Heat map of 27 bioactive factors of the proteomic repertoire of NR8383 alveolar macrophages after 16 h of exposure to different unfunctionalized silica particles at 100 µg mL−1 (subtoxic level) as obtained by protein microarrays. Each row of the heat map represents the expression of one factor relative to its expression in supernatants of NR8383 cells without particle exposure (control). The green colors represent lower, the red colors represent higher expression of factors relative to the control. The color intensity scale shows fold changes at the upper left corner of the figure.

