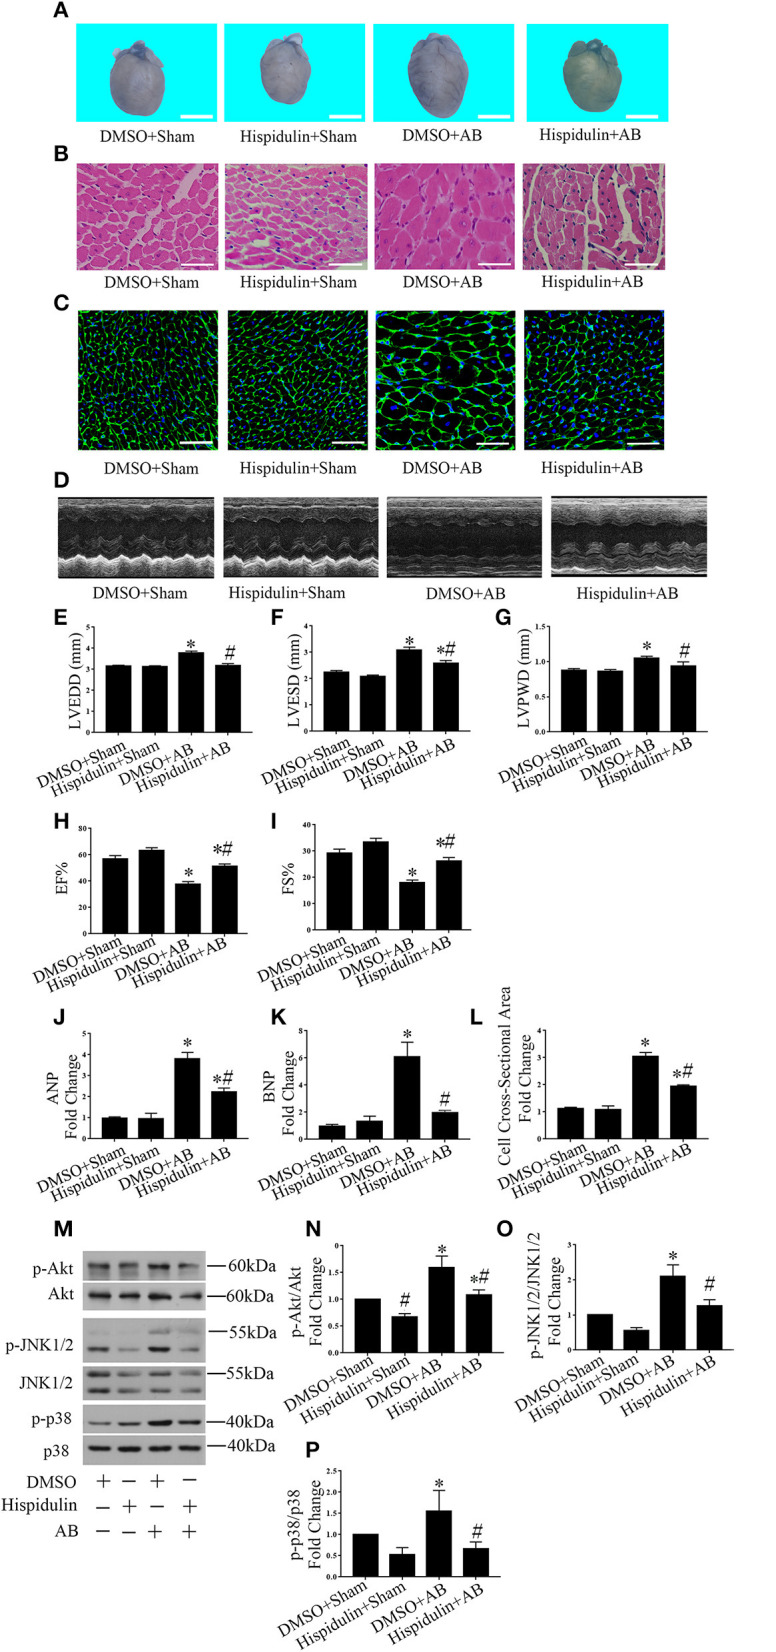
Figure 1.

Hispidulin suppressed cardiac hypertrophy in vivo. Hispidulin was intraperitoneally injected into mice 1 day before surgery through 4 weeks after surgery. (A) Images of hearts harvested 4 weeks after surgery. The scale bar reflects 2 mm. (B) H&E staining of heart paraffin sections 4 weeks after surgery. Scale bar reflects 50 μm. (C) WGA staining of mouse heart sections 4 weeks after surgery. Scale bar reflects 50 μm. (D) Echocardiographic images of the hearts in each group. (E–H) Histograms of LVEDD (E), LEVSD (F), LVPWD (G), EF% (H), and FS% (I) (n = 8–12). (J,K) The mRNA levels of ANP and BNP in each group. GAPDH served as an internal control (n = 4–6). (L) Quantification of the heart cross-sectional area of each group. At least 50 cells were counted in each heart (n = 3–5). (M) Representative immunoblots of hypertrophic pathways, including Akt, JNK1/2, and p38. (N–P) Quantitative analysis of phosphorylated and total Akt (N), JNK1/2 (O), p38 (P) expression in vivo (n = 3–5). Data are expressed as the mean ± SE. Significance of the difference between DMSO+Sham and DMSO+AB or between Hispidulin+Sham and Hispidulin+AB: *p < 0.05; significance of the difference between DMSO+Sham and Hispidulin+Sham or between DMSO+AB and Hispidulin+AB: #p < 0.05 (n represents the number of independent experiments).
