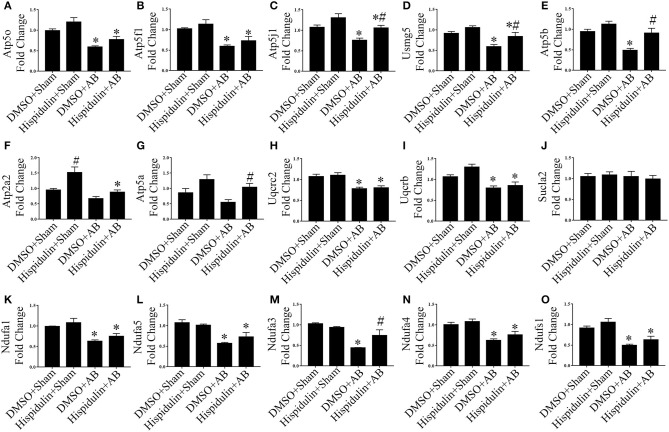
Figure 4.
Hispidulin restored mitochondrial oxidative phosphorylation in mice. (A–O) Relative gene expression levels of oxidative phosphorylation complex subunits including Atp5o (A), Atp5f1 (B), Atp5j1 (C), Usmg5 (D), Atp5b (E), Atp2a2 (F), Atp5a (G), Uqucrc2 (H), Uqucrb (I), Sucla2 (J), Ndufa1 (K), Ndufa5 (L), Ndufa3 (M), Ndufa4 (N), and Ndufs1 (O) were determined by qPCR (n = 3–4). Data are expressed as the mean ± SE. Significance of the difference between DMSO+Sham and DMSO+AB or between Hispidulin+Sham and Hispidulin+AB: *p < 0.05; significance of the difference between DMSO+Sham and Hispidulin+Sham or between DMSO+AB and Hispidulin+AB: #p < 0.05 (n represents the number of independent experiments).

