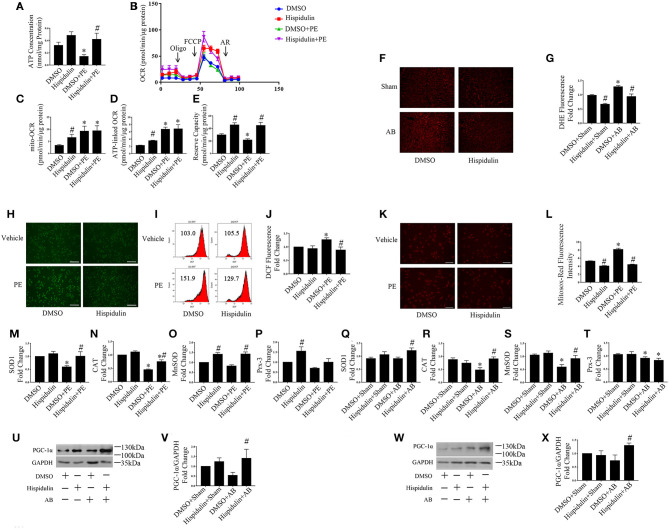
Figure 6.
Hispidulin improved mitochondrial dysfunction. (A) ATP concentration in cardiomyocytes was measured by a bioluminescence assay (n = 3). (B) Mitochondrial respiration in cardiomyocytes was measured using a Seahorse XFe 24 analyzer (n = 3). Quantification analysis of mito-OCR (C), ATP-linked OCR (D), and reserve capacity (E) in each group (n = 3). Significance of the difference between DMSO and DMSO+PE or between Hispidulin and Hispidulin+PE: *p < 0.05; significance of the difference between DMSO and Hispidulin or between DMSO+PE and Hispidulin+PE: #p < 0.05. (F) Representative images of DHE-stained heart frozen sections. (G) Fluorescence intensity was measured by ImageJ software (n = 3). Significance of the difference between DMSO+Sham and DMSO+AB: *p < 0.05; significance of the difference between DMSO+Sham and Hispidulin+Sham or between DMSO+AB and Hispidulin+AB: #p < 0.05. (H) Representative images of DCF-DA-stained cardiomyocytes. Scale bar reflects 200 μm. (I,J) Fluorescence intensity was measured by flow cytometry (n = 4). (K) Mitosox-Red staining was performed to estimate the mitochondrial ROS levels in cardiomyocytes. (L) Representative images of Mitosox-Red-stained cardiomyocytes. Scale bar reflects 100 μm. Fluorescence intensity was measured using ImageJ software (n = 3). (M–P) The expression levels of antioxidant genes SOD1 (M), CAT (N), MnSOD (O), Prx-3 (P) in cardiomyocytes were measured by qPCR. GAPDH was used as an internal control (n = 3–6). Data are expressed as the mean ± SE. Significance of the difference between DMSO and DMSO+PE or between Hispidulin and Hispidulin+PE: *p < 0.05; significance of the difference between DMSO and Hispidulin or between DMSO+PE and Hispidulin+PE: #p < 0.05. (Q–T) The expression levels of antioxidant genes SOD1 (Q), CAT (R), MnSOD (S), Prx-3(T) in mouse hearts were measured by qPCR. GAPDH was used as an internal control (n = 3–6). (U) Representative immunoblots of the effects of hispidulin on the expression of PGC-1α in mice 1 week after surgery. (V) Quantitative analysis of PGC-1α and GAPDH expression in vivo (n = 5). (W) Representative immunoblots of the effects of hispidulin on the expression of PGC-1α in mice 4 weeks after surgery. (X) Quantitative analysis of PGC-1α and GAPDH expression in vivo (n = 4). Data are expressed as the mean±SE. Significance of the difference between DMSO+Sham and DMSO+AB or between Hispidulin+Sham and Hispidulin+AB: *p < 0.05; significance of the difference between DMSO+Sham and Hispidulin+Sham or between DMSO+AB and Hispidulin+AB: #p < 0.05 (n represents the number of independent experiments).

