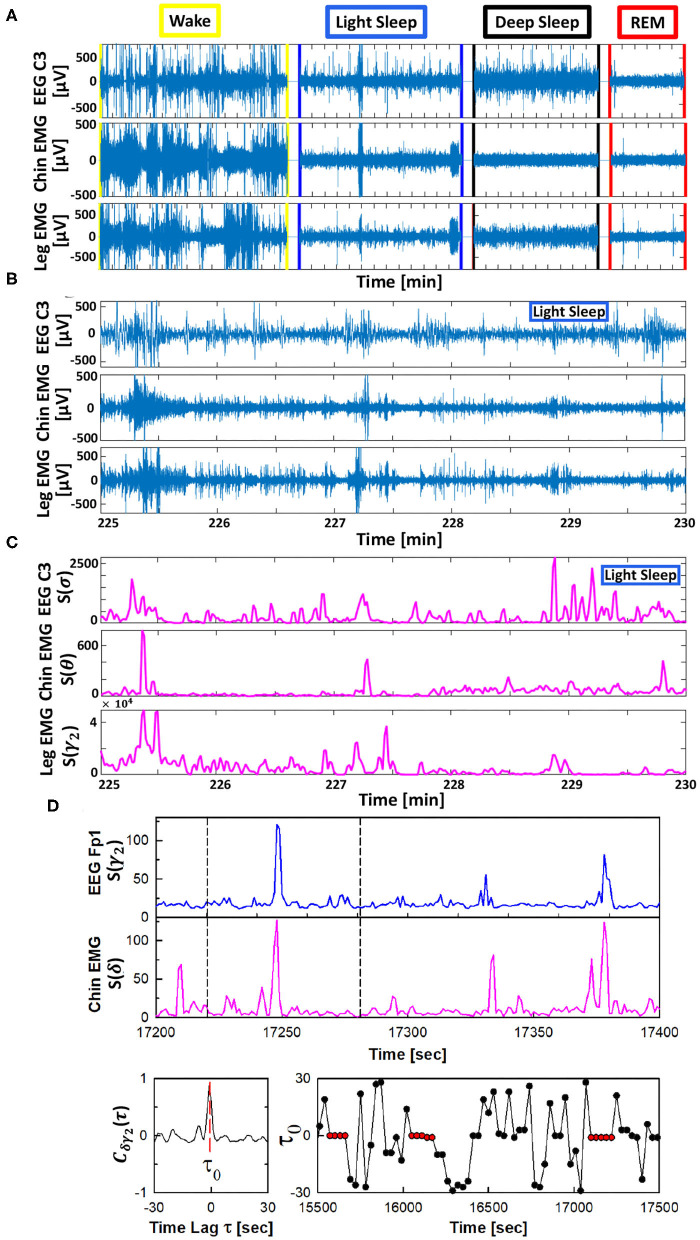
Figure 1.
Schematic presentation of the Time Delay Stability (TDS) method. Based on the concept of time delay stability the TDS method is designed to quantify coupling in diverse physiological systems with bursting dynamics. (A) Segments of 10-15 min raw signals from brain central EEG C3, chin muscle tone EMG and leg muscle tone EMG channels during different physiological states. (B) Magnified section (5 min segments) of the raw signal with bursting morphology for brain C3 and chin and leg muscle tone during LS. (C) Spectral power S(f) for a combination of chosen frequency bands for the raw data shown in (B). (D) (top panels) Brain EEG spectral power S(f) in the γ2-band (from frontal Fp1 channel) and chin muscle tone EMG spectral power in the δ-band. Segments with synchronous bursts in S(γ2) and S(δ) lead to a pronounced peak in the cross-correlation C(τ) at time lag τ0 (shown in the left bottom panel for the 60 s window marked by vertical dashed lines in the top panels). Periods with stable time delay are characterized by constant τ0 (red dots in B, right panel). Cross-correlation C(τ) is performed for overlapping windows of 60 s with a moving step of 30 s, and the time lag τ0 corresponding to the peak of C(τ) in each window is recorded (shown in the right bottom panel), where consecutive red dots indicate periods of time delay stability with constant τ0 (see Materials and Methods section 2.3). Long periods of constant time delay τ0 indicate strong TDS coupling, represented by strong links in the network of physiologic interactions between cortical EEG rhythms and muscle tone frequency bands. The TDS approach is general, and can identify and quantify interactions between diverse systems with different dynamic characteristics across physiological states.

