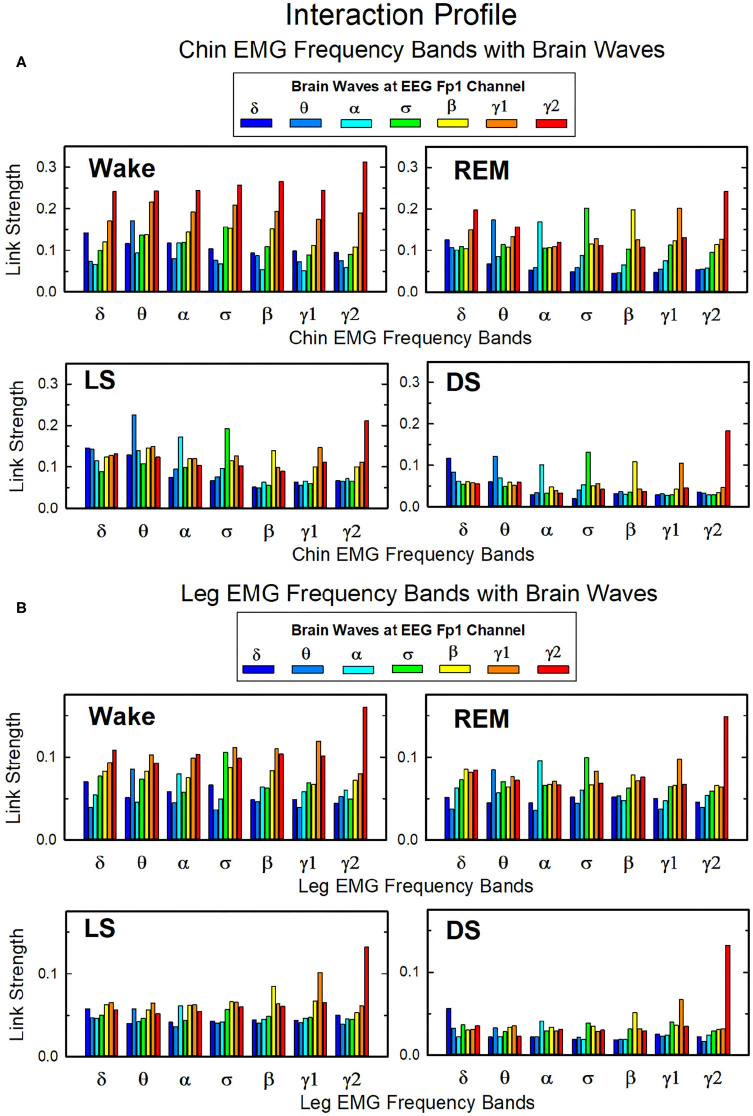
Figure 10.
Network links of interaction between cortical rhythms and muscle tone frequency bands. Histograms of group-averaged of network links as measured by the TDS method (Materials and Methods section 2.3) representing the strength of interaction between brain cortical rhythms (δ, θ, α, σ, β, γ1, γ2) and the corresponding EMG frequency bands of (A) chin and (B) leg muscle tone for different sleep stages. Shown are network links for cortical rhythms from the Frontal Fp1 area. Links are grouped to present the interaction of each cortical rhythm with all EMG bands. Figure panels show the Fp1 profile of network links strength (Figures 7, 9) for different sleep stages—the average links strength of each group in a panel is presented as a separate bar in the Fp1 profile in Figures 7, 9. Histograms show an inhomogeneous distribution of links strength, where interactions tend to be stronger for links between same frequency cortical rhythms and EMG frequency bands—e.g., δEEG-δEMG, θEEG-θEMG, etc., where the γ2EEG-γ2EMG coupling is particularly pronounced. This tendency is more evident in the brain-chin compared to the brain-leg network, and during REM, light and deep sleep compared to wake (pair-wise comparison between links in each group gives p < 0.05 (MW test) for the γ2EEG-γ2EMG, indicating statistical significance of network links mediated by same EEG and EMG frequency bands).

