Figure 11.
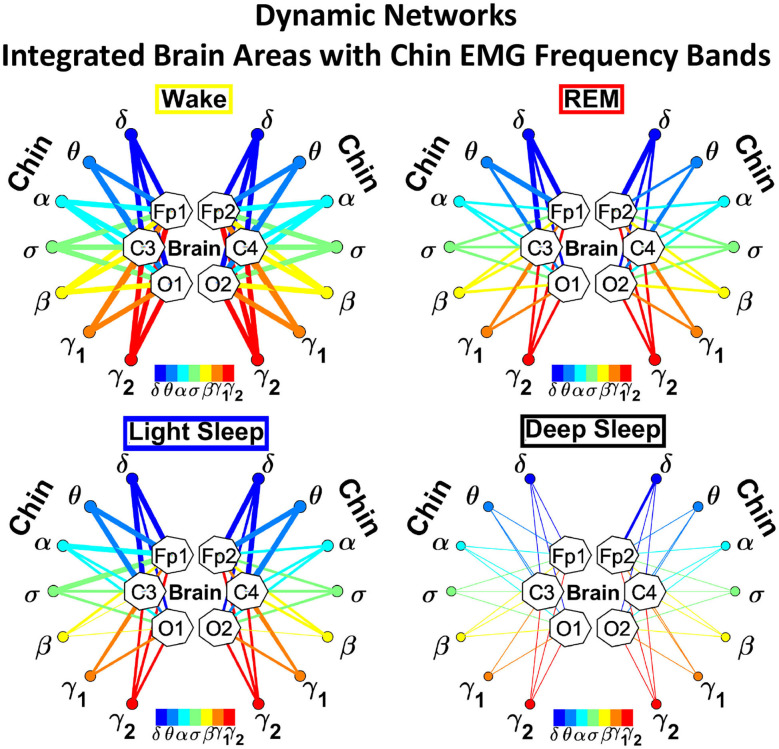
Dynamic networks of individual chin EMG frequency bands and integrated brain dynamics at cortical locations for different physiological states. Links in network maps represent group-averaged TDS coupling strength (section Materials and Methods 2.5.1) between each frequency band of chin muscle tone and a given cortical location, after averaging over all brain waves (see Figure 4 and section Materials and Methods 2.5.3), and correspond to the elements in the coarse-grained matrices shown in Figure 5A, right panels. Brain areas are represented by Frontal (Fp1, Fp2), Central (C3, C4), and Occipital (O1, O2) EEG channels, while peripheral network nodes with different colors represent the chin muscle tone frequency bands. Line thickness indicates link strength (thin links with 3% ≤ TDS < 5%, intermediate links with 5% ≤ TDS < 7.5% and thick links with TDS ≥ 7.5%), and links color corresponds to the color of the EMG network nodes. The chin-to-brain communication network and its dominant pathways depend on the physiologic state (sleep stage). All links across EMG bands are strong during wake independently of the brain area. During REM and LS we observe stronger links between low-frequency chin EMG δ and θ bands and the frontal (Fp1 and Fp2) and central (C3 and C4) brain areas. Links are generally weaker during DS, and the strongest links are those connecting δ and θ bands to the frontal areas.

