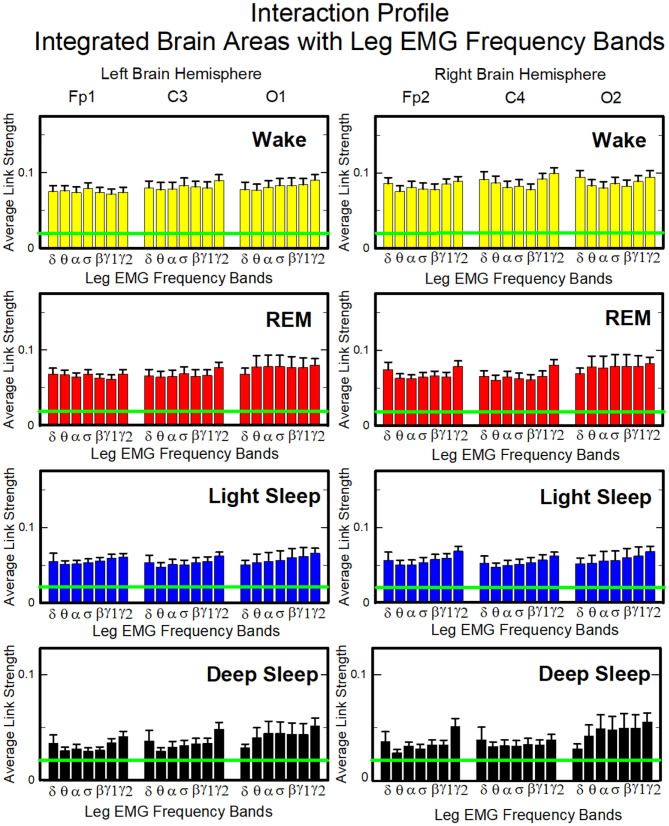
Figure 14.
Characteristic profiles of network links strength representing interactions between integrated brain activity at cortical areas and individual leg-EMG frequency bands. Group-averaged links strength is obtained using the TDS method (Materials and Methods section 2.3), where each link represents the interaction of brain activity from a given cortical area (averaged over all brain waves derived from the EEG channel located at this cortical area) and each muscle tone rhythm (frequency band) derived from the leg-EMG signal. Links are grouped by brain cortical areas in both left and right hemisphere (Frontal Fp1 and Fp2, Central C3 and C4, Occipital O1 and O2; marked on top of the panels), and are ordered from low- to high-frequency leg-EMG bands. Bars indicate the strength of links shown on the network maps in Figure 13. Note, that the average strength of each group of links in the panels corresponds to a separate bar in Figure 8B, and the displayed profiles provide detailed information on the interaction between averaged cortical activity at a given EEG channel location with each individual leg-EMG frequency band. Error bars represent the standard error obtained for all subjects in the group; horizontal green lines mark a threshold %TDS = 2.3% (based on surrogate test, section Method 2.4) above which network interactions are physiologically significant with >97% confidence level. Bar-charts show absence of dominant links in the interactions of leg-EMG bands with cortical areas, and a flat profile of links strength across EMG bands for all cortical brain areas during all sleep stages (one-way ANOVA p ≥ 0.21, indicating no significant difference between links in each profile). Links strength profiles show clear symmetry between left and right hemisphere (pair-wise MW tests p ≥ 0.67, indicating no significant difference).

