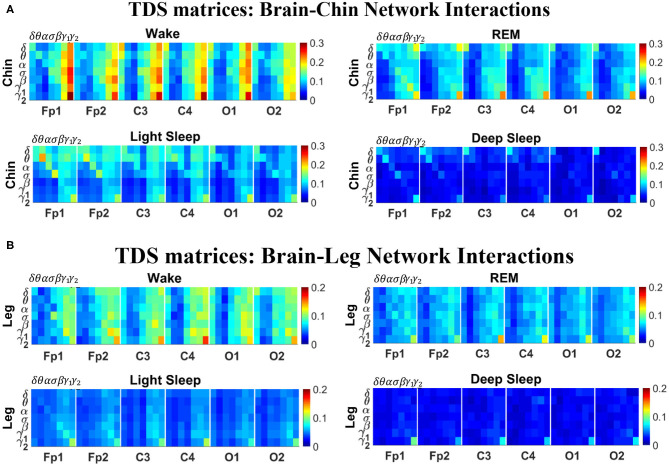
Figure 2.
TDS matrix representation of brain-muscle network connectivity across physiologic states. Group-averaged Time Delay Stability (TDS) matrices represent physiological interactions during wake, REM, light and deep sleep. Matrix elements show the coupling strength between seven physiologically-relevant cortical rhythms (δ, θ, α, σ, β, γ1, γ2) derived from six EEG channels (x-axis: Frontal Fp1 and Fp2; Central C3 and C4; Occipital O1 and O2) and the corresponding EMG frequency bands (y-axis) representing chin and leg muscle activation (shown in A,B). Coupling (network links) strength is quantified by the fraction of time (out of the total duration of a given sleep stage throughout the night) when TDS is observed. Matrix elements are obtained by quantifying the TDS for each pair of EEG vs. EMG bands after calculating the weighted average of all subjects in the group (Methods section 2.3). Color code indicates TDS coupling strength. The average number of synchronized bursts per minute corresponding to periods of time delay stability depends on the physiologic state: 0.21 ± 0.08 for Wake, 0.17 ± 0.07 during REM, 0.15 ± 0.05 during LS and 0.08 ± 0.04 during DS. Brain-chin and brain-leg network interactions exhibit pronounced sleep-stage stratification: strong coupling across all pairs of EEG vs. EMG bands during wake, intermediate for REM and light sleep, and weak coupling during deep sleep. Notably, high frequency cortical rhythms are the dominant mediator of both brain-chin and brain-leg interactions (warmer colors for vertical columns representing coupling of β, γ1, γ2 brain waves with EMG muscle bands)—characteristic that is consistently observed across all sleep stages.

