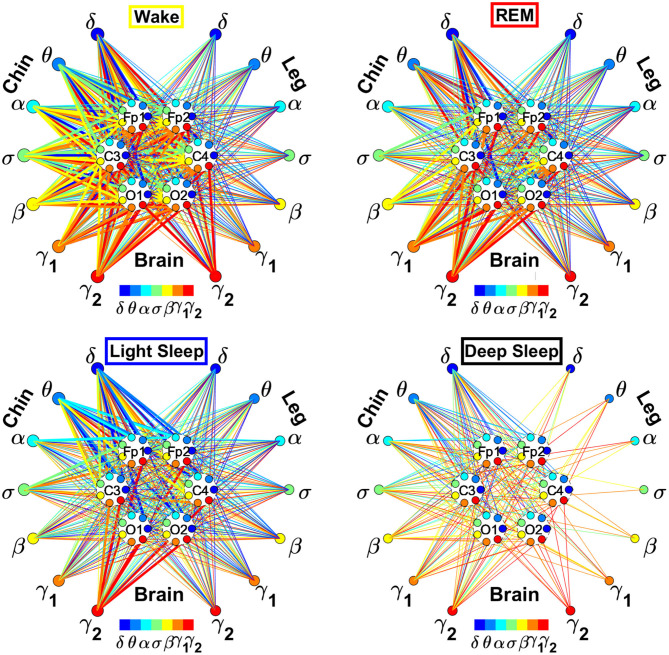
Figure 3.
Dynamic networks of cortico-muscular interactions across physiological states. Network maps are obtained based on the group-averaged TDS matrices in Figure 2 representing physiological interactions during wake, REM, light, and deep sleep. Network links correspond to the TDS matrix elements, and show the coupling strength between seven physiologically relevant brain waves (δ, θ, α, σ, β, γ1, γ2) across cortical locations and muscle tone EMG frequency bands. Brain areas are represented by Frontal (Fp1 and Fp2), Central (C3 and C4), and Occipital (O1 and O2) EEG channels, where color nodes in each brain area represent distinct brain waves. Peripheral nodes indicate corresponding EMG frequency bands of chin and leg muscle tone shown in same color code as the brain waves. Links reflect the coupling strength between cortical rhythms at different locations and EMG frequency bands as quantified by the TDS measure (Materials and Methods 2.3). Links strength is marked by line width—thin lines for 3% < %TDS < 12%; thick lines for %TDS > 12%. All links above the threshold %TDS = 3% are shown; link color corresponds to the color of brain wave node involved in the interaction. A complex reorganization of network topology and links strength is observed with transition from one sleep stage to another, indicating a remarkable association between functional networks of cortico-muscular interaction and physiological states.

