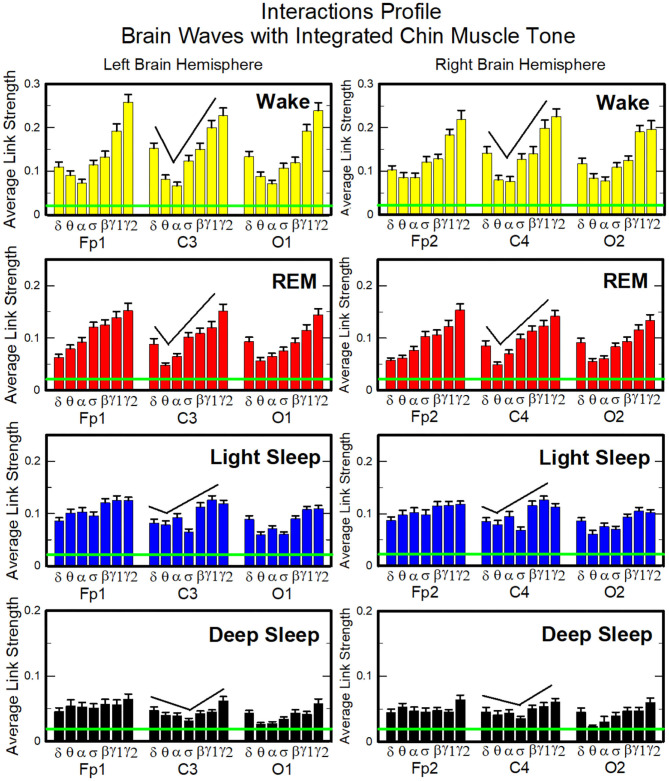
Figure 7.
Characteristic profiles of network links strength for cortical rhythms interactions with integrated chin-muscle tone. Group-averaged links strength is obtained using the TDS measure, where each link represents the interaction of chin muscle tone (averaged over all EMG bands, as shown in Figures 4, 5A, left panel) with each cortical rhythm at a given brain area. Link strengths are grouped by brain areas (Frontal Fp1 and Fp2, Central C3 and C4, Occipital O1 and O2), and are ordered from low- to high-frequency cortical rhythms for each area, matching the network graph presentation of links between network nodes (cortical rhythms) in each brain location and the radar-charts (sum of interactions with all chin EMG bands) as shown in Figure 6A. A characteristic profile of network links strength as function of cortical rhythms frequency is consistently observed for all brain areas in both left and right hemisphere—strongest network interactions mediated through the high-frequency γ2 cortical rhythm, a gradual decrease in links strength for the lower-frequency rhythms (γ1, β, σ, α, θ), followed by increase in links strength for the lowest-frequency δ brain wave. This characteristic profile is well-pronounced during wake, REM and light sleep (one-way ANOVA tests p ≤ 0.001), and gradually flattens for deep sleep (one-way ANOVA test p = 0.3). Notably, the profile is robust, exhibiting almost identical shape and matching strength of network links within the profile for both left and right brain hemisphere during each sleep stage. The pronounced sleep-stage stratification observed for the network links strength in the brain-chin radar-charts (shown as change in size of hexagons in Figure 6A) is consistently present for the links to all cortical rhythms and brain areas—stronger links during wake, intermediate during REM and light sleep, and weaker links during deep sleep. Error bars represent the standard error obtained for all subjects in the group; horizontal green lines in both panels mark a surrogate test threshold (%TDS = 2.3%; section Method 2.4) above which network interactions are physiologically significant.

