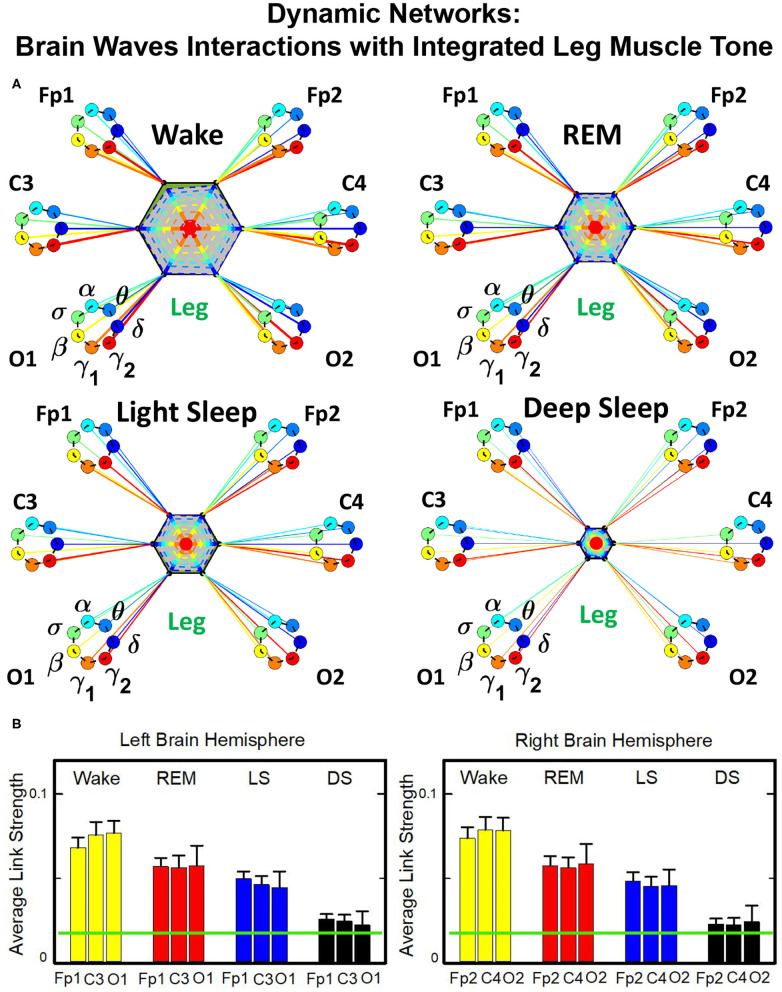
Figure 8.
Dynamic networks of cortical rhythms and integrated leg-muscle tone interactions across physiological states. (A) Links in network maps represent group-averaged TDS coupling strength (section Materials and Methods 2.5.1) between each brain rhythm at a given cortical location and the leg muscle tone, after averaging over all leg EMG frequency bands (see Figure 4 and section Materials and Methods 2.5.2). Links correspond to the elements in the coarse-grained matrices shown in figure 5B left panels. Brain areas are represented by Frontal (Fp1, Fp2), Central (C3, C4), and Occipital (O1, O2) EEG channels, and network nodes with different colors mark cortical rhythms (δ, θ, α, σ, β, γ1, γ2). Links strength is indicated by line thickness; links color corresponds to the color of cortical rhythms (network nodes). Shown are links with strength %TDS ≥ 2.3%, corresponding to the significance threshold derived from surrogate tests (section Method 2.4). Radar-charts centered in the leg hexagons represent the relative contribution of different brain areas to the strength of network links during different sleep stages. The length of each segment along each radius in the radar-charts represents TDS coupling strength between each cortical rhythm at each EEG location and the leg muscle tone averaged over all EMG bands. Segments in the radar-charts are shown with same color as the corresponding brain rhythms (network nodes). Brain-leg network interactions are mainly mediated through high frequency γ1 and γ2 cortical rhythms (thicker orange and red links), and exhibit relatively symmetric links strength to all six cortical areas, as shown by the symmetric radar-chart in each hexagon. Networks reorganize with transition across sleep stages: stronger network links during wake (larger hexagon), intermediate during REM and light sleep, and much weaker interactions (smaller hexagon) during deep sleep. The sleep-stage reorganization in brain-leg network interactions is consistent with the brain-chin network (Figure 6). (B) Histograms of links strength in the brain-leg network during different sleep stages. Group-averaged links strength is obtained using the TDS measure, where each bar represents the average strength of interaction of all cortical rhythms from a given brain area (Frontal, Central or Occipital) with all muscle tone EMG bands. Error bars represent the standard error obtained for all subjects in the group; horizontal green lines in both panels mark a surrogate test threshold (%TDS = 2.3%; section Method 2.4) above which network links are significant. A pronounced sleep-stage stratification pattern is observed for the average links strength related to each cortical area, consistent for both left and right hemisphere (pair-wise comparison between sleep stages for the same brain area gives MW test p ≤ 0.05, and one-way ANOVA rank test comparison across all sleep stages gives p ≤ 0.001). Brain-leg network interactions exhibit strong symmetry in links strength between the left and right hemisphere for all sleep stages (MW test p ≥ 0.67).

