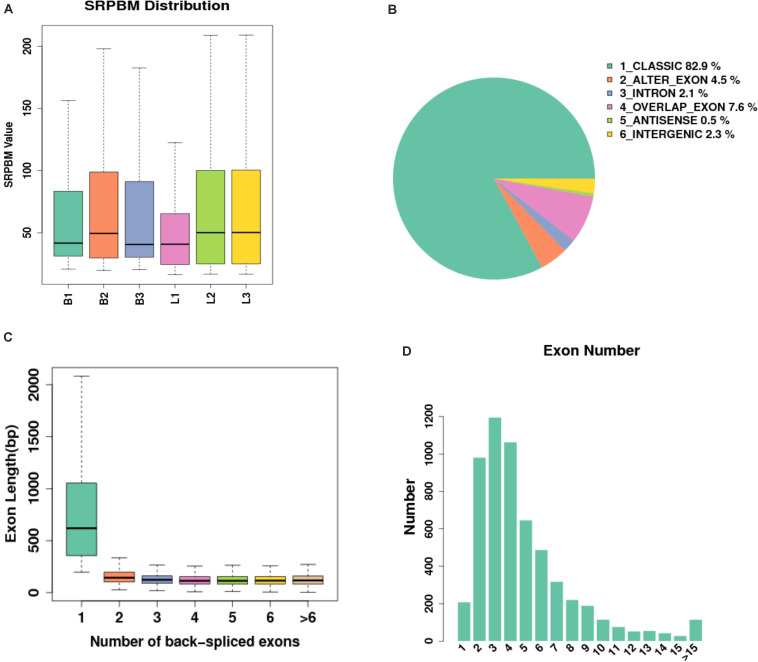
FIGURE 2.
Expression level of sample circRNAs. (A) SRPBM density: distribution density of circRNA expression in the sample; SRPBM value: the normalized count value of circRNAs, calculated by a formula [SRPBM = (SR×109)/N] in which SR is the number of spliced reads, and N is the total number of mapped reads in samples. (B) Distribution pie chart of the six types of circRNAs; (C) Box plot of the single exon length distribution of circular RNAs. The abscissa represents the number of exons contained in the circRNA, and the ordinate represents the length of a single exon; (D) The distribution of the number of exons contained in circular RNAs in the sample, the abscissa represents the number of exons, and the ordinate represents the number of circRNAs corresponding to the number of exons.

