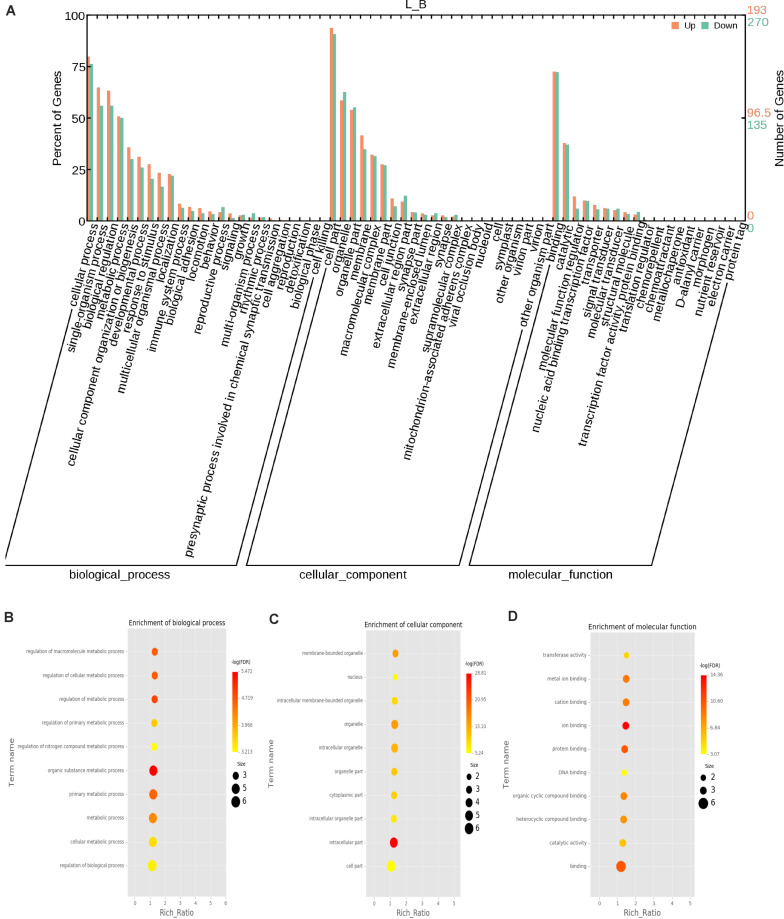
FIGURE 4.
GO annotation of differential circRNAs and enrichment analysis. (A) GO annotation of the parental genes of DE circRNAs. The abscissa is the ontology classification, and the ordinate is the proportion of genes annotated to this term among all annotated genes; (B–D) Q-value enrichment map of single group GO entries. Each point represents the estimated enrichment degree of the corresponding GO term, and the closer the color is to red, the higher the enrichment degree. The size of each point indicates the number of genes enriched in the GO term, and the larger the point is, the more genes enriched in the GO term, and vice versa.

