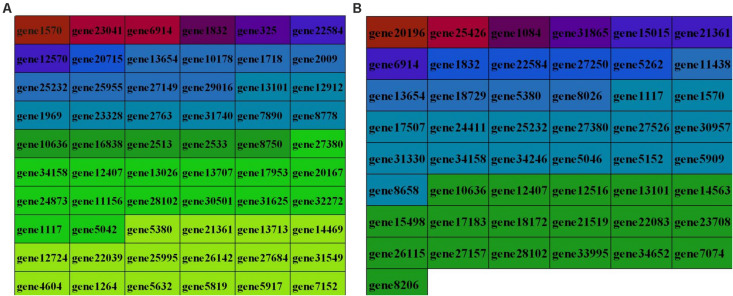
FIGURE 5.
Enrichment degree of the identified parental genes in GO terms (A) and KEGG pathways (B). Different colors indicate the different enrichment degrees of parental genes in terms related to muscle growth and development. The darker the color, the higher the enrichment degree and the lighter the color, the lower the enrichment degree; the enrichment degree of source genes is arranged from high at the top to low at the bottom.

