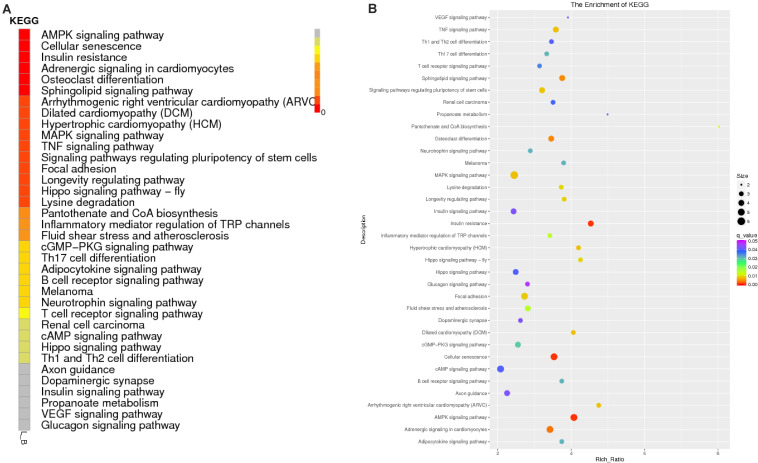
FIGURE 6.
Enrichment results of the KEGG analysis. (A) Enrichment path Q-value distribution map, in which the vertical coordinate is the KEGG pathway entry, horizontal coordinate is the name of the sample, and different colors represent different enrichment degrees; (B) KEGG enrichment Q-value results for single groups, whereby each point represents the enrichment degree of the KEGG entry, and the closer the color is to red, the higher the enrichment degree. The size of each point indicates the number of genes enriched in the KEGG entry, and the larger the point is, the more genes enriched in the KEGG entry, and vice versa.

