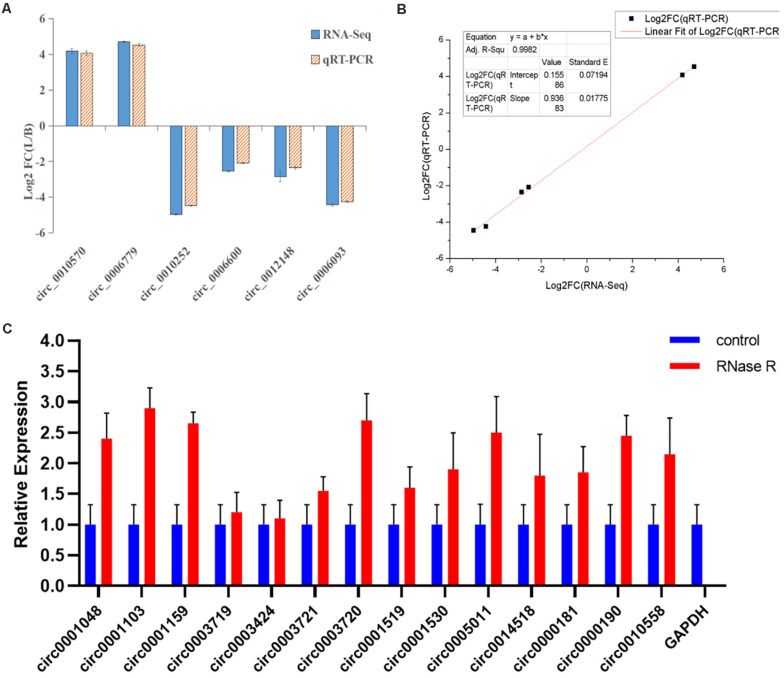
FIGURE 8.
Linear fitting of RNA-seq and qRT-PCR circRNA expression data. (A) The circRNAs related to muscle growth and development were selected for qRT-PCR analysis. (B) The six selected circRNAs showed consistent results between the RNA-seq and qRT-PCR analyses, with a correlation coefficient (R2) = 0.9982. (C) After RNase R treatment, the expression level of circRNAs and GAPDH were measured. The X-axis indicates circRNAs, and the Y-axis indicates the relative expression level of circRNAs and GAPDH. Error bars indicates ±SD.

