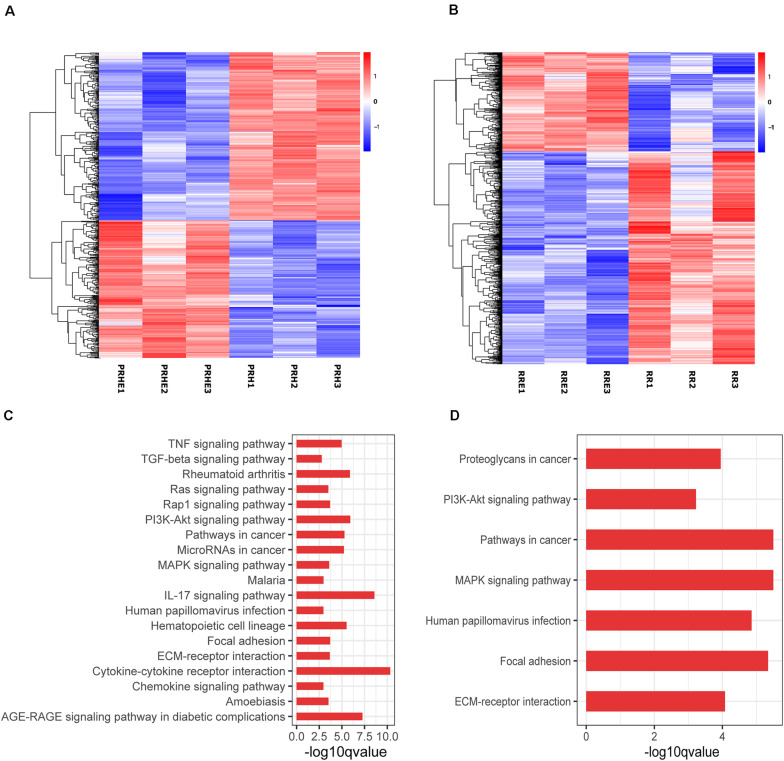
FIGURE 8.
Results of RNA-seq in ESCs-cocultured premature and replicative senescent RPE cells. (A) The heat map of all differentially expressed genes for the PRH and PRHE groups (n = 3 biological repeats). (B) The heat map of all differentially expressed genes for the RR and RRE groups (n = 3 biological repeats). The horizontal axis represents three biological repeats of the samples, and the vertical axis represents the genes. The red color indicates upregulated expression and the blue color indicates downregulated expression. (C) The bar diagram of Kyoto Encyclopedia of Genes and Genomes (KEGG) pathway analysis of the PRH and PPHE groups (n = 3 biological repeats). (D) The bar diagram of KEGG pathway analysis of the RR and RRE groups (n = 3 biological repeats). The abscissa represents the enrichment degree. The greater –log10 q value indicates the higher enrichment degree of KEGG pathway. The ordinate represents the name of the KEGG pathway.

