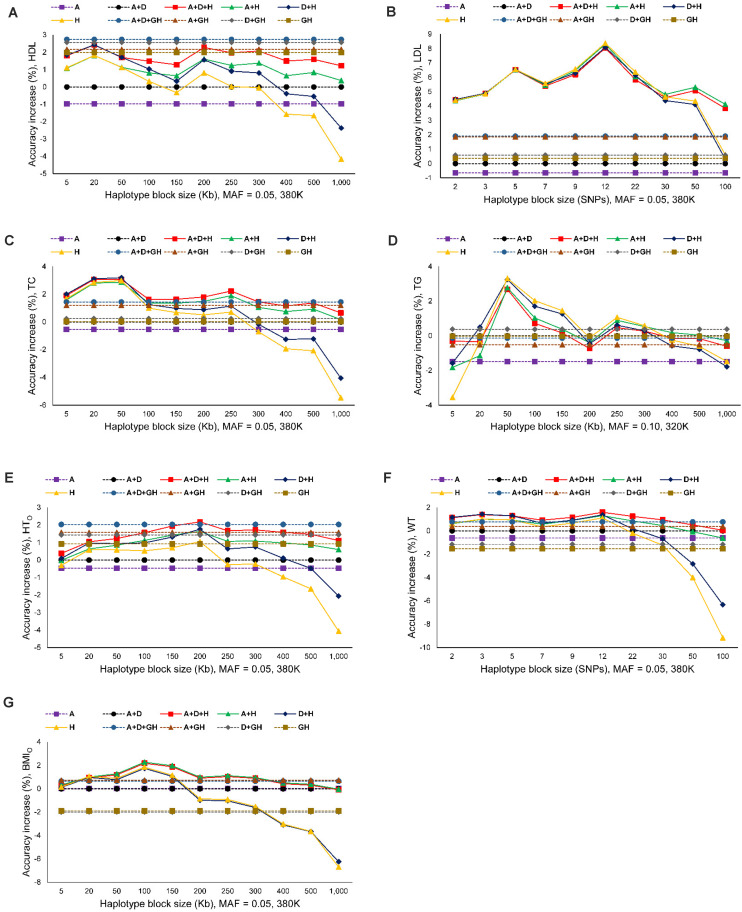
FIGURE 2.
Prediction accuracy of best haplotype models relative to the SNP models and gene-based haplotype models. (A) High-density lipoproteins (HDL). (B) Low-density lipoproteins (LDL). (C) Total cholesterol (TC). (D) Triglycerides (TG). (E) Height using the original phenotypic observations (HTO). (F) Weight (WT). (G) Body mass index using the original phenotypic observations (BMIO). A = SNP additive values. D = SNP dominance values. H = haplotype additive values. GH = haplotype additive values of genes.

