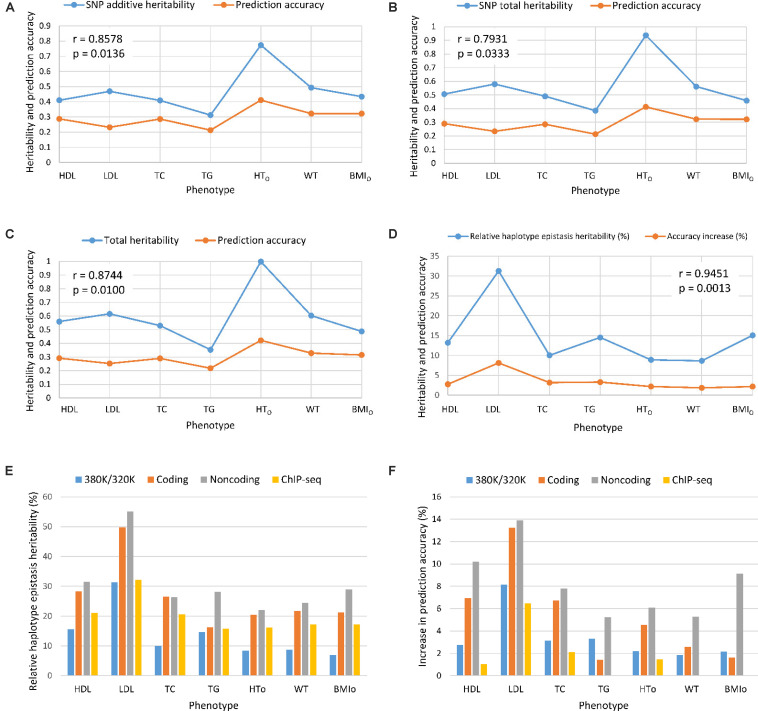
FIGURE 3.
Prediction accuracy had strong concordance with the size of heritability estimates. (A) SNP additive heritability and prediction accuracy. (B) SNP total heritability and prediction accuracy. (C) Prediction accuracy and total heritability as summation of all heritabilities of the prediction model. (D) Relative haplotype epistasis heritability and accuracy increase. (E) Relative haplotype epistasis heritability estimates in functional regions. (F) Accuracy increase due to haplotypes relative to SNPs in functional regions. r = correlation coefficient. p = probability that the null hypothesis of correlation is true = significance level.

