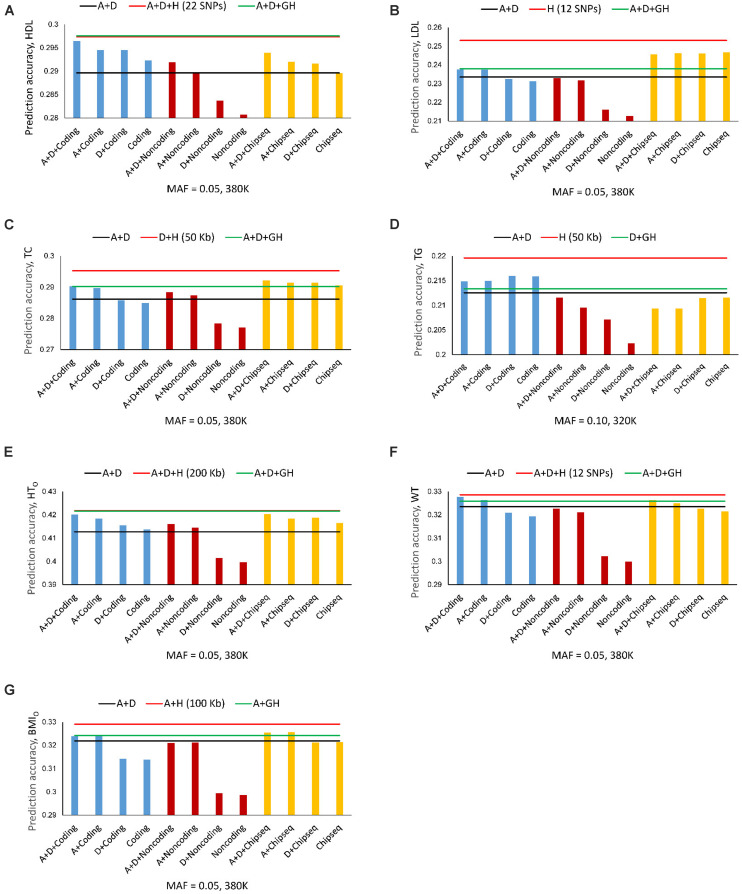
FIGURE 4.
Average prediction accuracy of coding genes, noncoding genes and ChIP-seq from ten-fold validations relative to the prediction accuracy of SNP models with additive and dominance values (black line), the best autosome gene haplotype model (green line), and the overall best haplotype model (red line). (A) High-density lipoproteins (HDL). (B) Low-density lipoproteins (LDL). (C) Total cholesterol (TC). (D) Triglycerides (TG). (E) Height using the original phenotypic observations (HTO). The red and green lines overlap. The red line is slightly higher but is invisible. (F) Weight (WT). (G) Body mass index using the original phenotypic observations (BMIO). A = SNP additive values. D = SNP dominance values. H = haplotype additive values. GH = haplotype additive values of genes.

