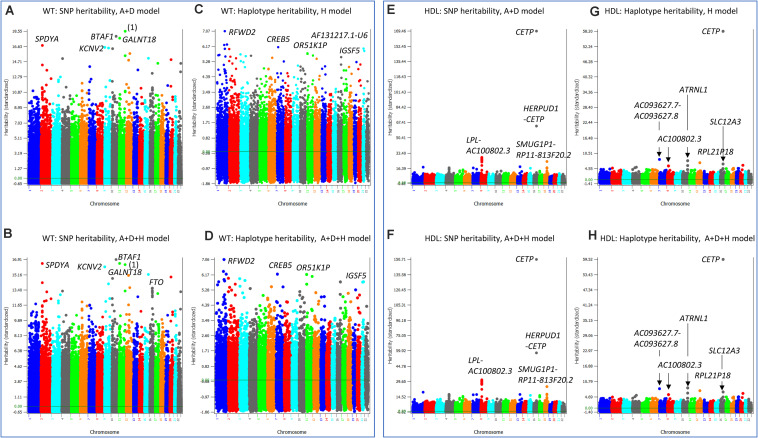
FIGURE 6.
SNP and haplotype heritability profiles of weight (WT) and high-density lipoproteins (HDL). (A) SNP additive heritability estimates of WT from the A + D model (Model 5). ‘(1)’ represents RP11-469N6.1-RP11-555G19.1. (B) SNP additive heritability estimates of WT from the A + D + H model (Model 1). (C) Haplotype additive heritability estimates of WT from the haplotype-only model (Model 4). (D) Haplotype heritability estimates of WT from the A + D + H model (Model 1). (E) SNP additive heritability estimates of HDL from the A + D additive model (Model 5). (F) Haplotype additive heritability estimates of HDL from the haplotype-only model (Model 4). (G) SNP additive heritability estimates of HDL from the A + D + H model (Model 1). (H) Haplotype heritability estimates of HDL from the A + D + H model (Model 1). A = SNP additive values. D = SNP dominance values. H = haplotype additive values. GH = haplotype additive values of genes.

