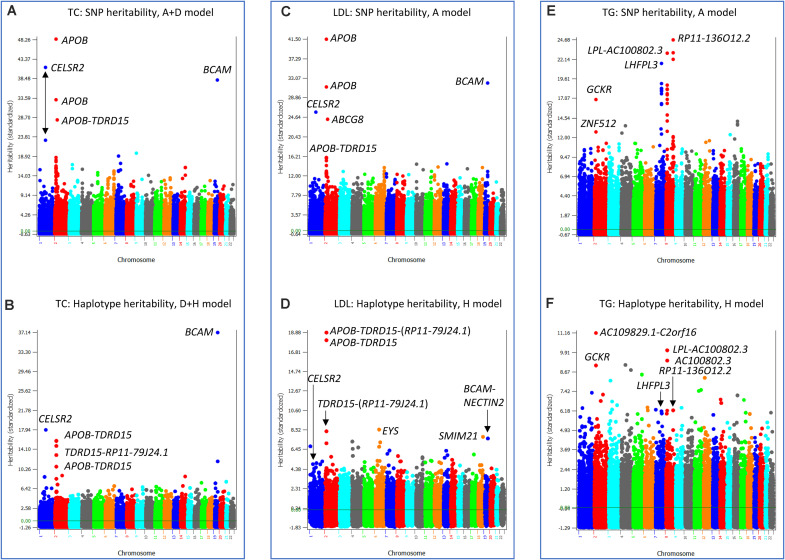
FIGURE 7.
SNP and haplotype heritability profiles of total cholesterol (TC), low-density lipoproteins (LDL) and triglycerides (TG). (A) SNP additive heritability estimates of TC from the A + D model (Model 5). (B) Haplotype additive heritability estimates of TC from the model with haplotype additive values and SNP dominance values (Model 3). (C) SNP additive heritability estimates of LDL from the SNP additive model (Model 6). (D) Haplotype heritability estimates of LDL from the haplotype-only model (Model 4). (E) SNP additive heritability estimates of TG from the SNP additive model (Model 6). (F) Haplotype heritability estimates of TG from the haplotype-only model (Model 4). A = SNP additive values. D = SNP dominance values. H = haplotype additive values. GH = haplotype additive values of genes.

