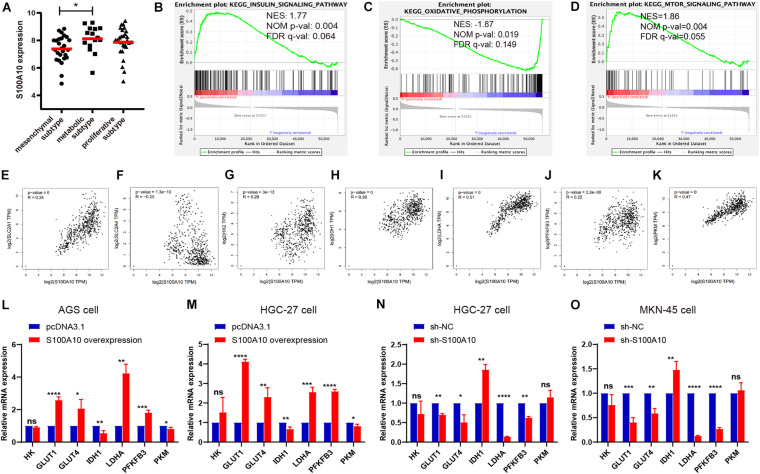
FIGURE 2.
S100A10 is closely correlated with glycolysis. (A) S100A10 showed the highest expression in the metabolic subtype of GC. (B–D) RNA-seq data of stomach adenocarcinoma samples were downloaded from the TCGA database. These samples were defined as S100A10-high and S100A10-low groups based on S100A10 expression. Gene set enrichment analysis (GSEA) was then performed and revealed that S100A10 was closely related to insulin signaling pathway, oxidative phosphorylation and mTOR signaling pathway. NES, normalized enrichment score; NOM, nominal; FDR, false discovery rate. (E–K) Correlation analysis between S100A10 and glycolytic transporters or enzymes in GC, including SLC2A1 (GLUT1), SLC2A4 (GLUT4), HK2, IDH1, LDHA, PFKFB3, and PKM. (L–O) The mRNA expression levels of glycolytic transporters or enzymes were assessed by RT-qPCR after S100A10 overexpression or knockdown. *P < 0.05, **P < 0.01, ***P < 0.001.

