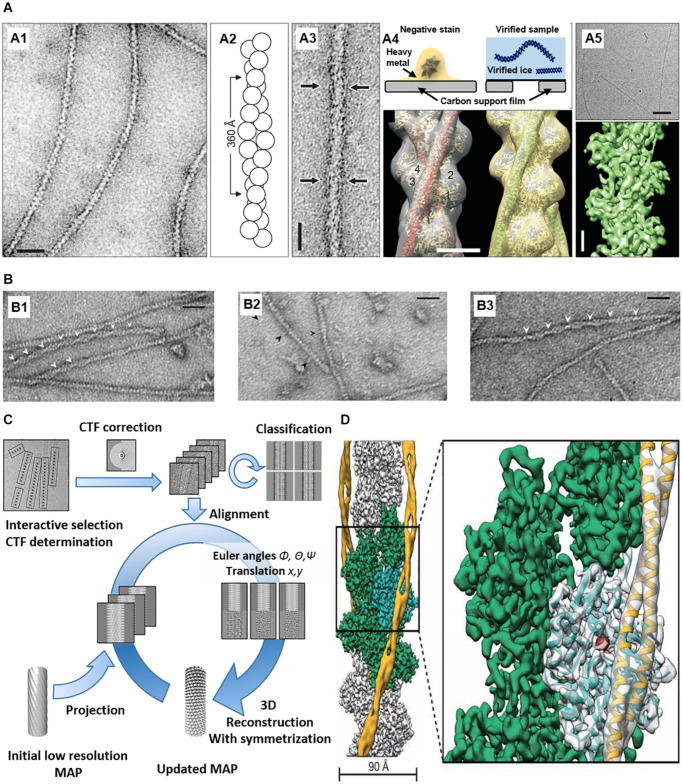
FIGURE 3.
EM imaging and 3D reconstruction of actin with ABPs in vitro. (A) (A1) Negatively stained F-actin. (A2) F-actin model based on EM. (A3) Negatively stained actin and ABP (arrows). (A4) (Top) Comparison between negative-stained EM and cryo-EM. (Bottom) 3D reconstruction of actin and ABPs based on negative staining data. (A5) Cryo-EM of F-actin (top) and 3D reconstruction at ∼5.5 Å resolution (bottom) Reprinted by permission from Korean Society of Microscopy (Craig, 2017). Scale bars = 200 Å (A1,A3), 50 Å (A4), 500 Å ((A5), top), 20 Å ((A5), bottom). (B) (B1) Actin filaments bound with cofilin-rod. Arrowheads show the intersection of the cofilin-rod clusters. (B2) Cofilin-rod molecules are rarely bound to actin filaments and identified by a rod-shaped structure (black arrowheads). (B3) Actin filaments with bound cofilin molecules (without rod fusion). Scale bars = 25 nm. Reprinted by permission from Ngo et al. (2015). (C) 3D reconstruction workflow. Reprinted by permission from Elsevier (Fromm and Sachse, 2016). (D) 3D reconstruction of actin with ABP (tropomyosin) from cryo-EM. PDB fitted to 3D EM volume. Scale bars = 90 Å. Reprinted by permission from Springer Nature (Von Der Ecken et al., 2015).

