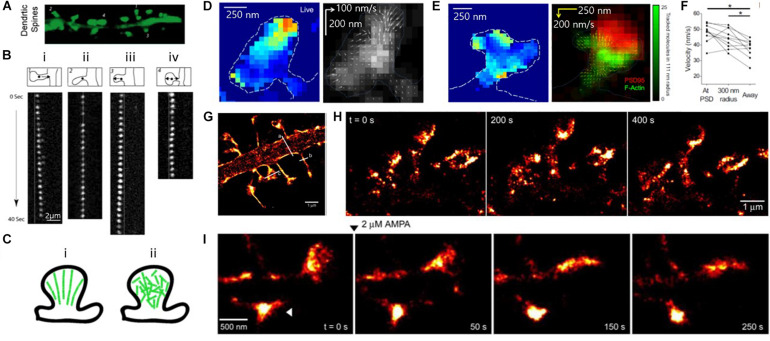
FIGURE 8.
Super-resolution PALM images of actin, showing heterogeneous actin dynamics within individual spines. (A) Fluorescence images of mature dendritic spines (23DIV). (B) Time-lapse image sequences of single EosFP-actin molecules showing (i) retrograde, (ii) stationary, (iii) anterograde, and (iv) random direction movement. (C) Models of actin organization in dendritic spines. (left) Highly polarized actin cytoskeleton, which is inconsistent with the experimental results. (right) Weakly polarized actin cytoskeleton, which is more consistent with the experimental results. Reprinted by permission from Tatavarty et al. (A∼C) (Tatavarty et al., 2009). (D, Left) Map of actin molecule velocity across the inner extent of a dendritic spine, showing restricted areas of high velocity. (Right) Representative spine showing inward orientation of actin flow. (Arrow length: relative velocity) (E) (Left) Actin velocity map and (Right) locally averaged molecular movement vector on the deconvolved widefield image of PSD-95-cerulean (red) with local tracked molecule density (green), showing some but not all foci of high-velocity motion are closely associated with the synapse. (D,E) Reprinted by permission from Elsevier (Frost et al., 2010). (F) Average velocity of tracked particles, showing tracked molecules originating at or near the PSD moved faster than molecules originating elsewhere in the cell. (D–F) Reprinted by permission from Elsevier (Frost et al., 2010) (G) Super-resolution PALM image of the dendritic segment. (H) Super-resolution time-lapse imaging of dendritic spines from a neuron expressing ABP-tdEosFP at DIV 27, showing spine dynamics in mature hippocampal neurons. (I) PALM images of spine dynamics during AMPAR (2 mM) activation, showing rounding-up spine after treatment (arrowhead) Reprinted by permission from Izeddin et al. (G∼I) (Izeddin et al., 2011).

