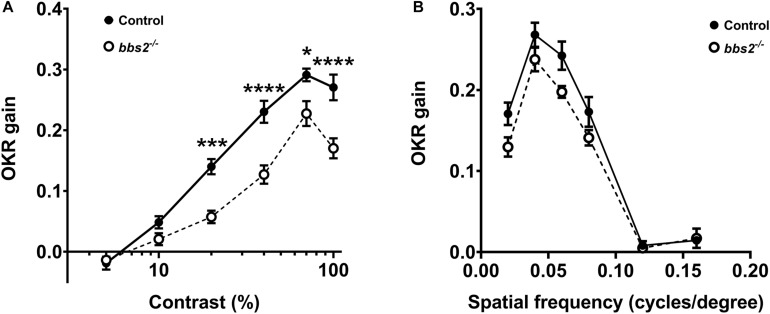
FIGURE 2.
bbs2 –/– mutant zebrafish have visual function deficits at 5 dpf. (A) Contrast response function and (B) spatial frequency function from 5 dpf control (closed circles, n = 13) and bbs2–/– mutants (open circles, n = 9) plotted as the OKR gain vs. the log contrast. OKR data are from 13 control and 9 mutant larvae. Error bars indicate SEM. Significant differences at individual points were discerned from Sidak’s multiple comparisons tests and indicated with asterisks. Significance levels are as follows: *p < 0.05; ***p < 0.001; ****p < 0.0001.

